You've heard the Republicans say it: the rich are "job creators"! Tax them more, and they will create fewer jobs! Taxes! Fear! Doom!
In a diary last week, "Occupy the tax code: why taxing the rich will make the economy soar," I showed that taxing the middle class is statistically associated with weaker GDP growth, while taxing the rich is statistically associated with stronger GDP growth.
Kossack NBBooks read that and issued me a challenge: now do the same kind of analysis for jobs. And he's right, of course: jobs is where the action is. That's the Republican meme. And if they're right, it should be easy to prove.
They're wrong.
In fact, the correlations here are more statistically significant than they were for GDP growth, even with fewer years of data. Follow below for the details.
Just for comparison, here's the GDP vs. tax rate chart again:
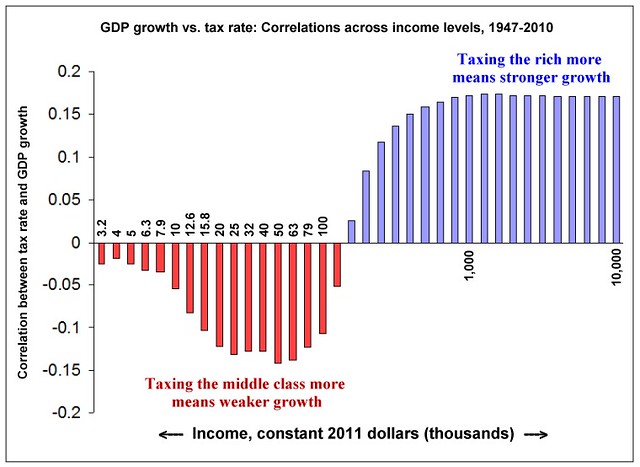
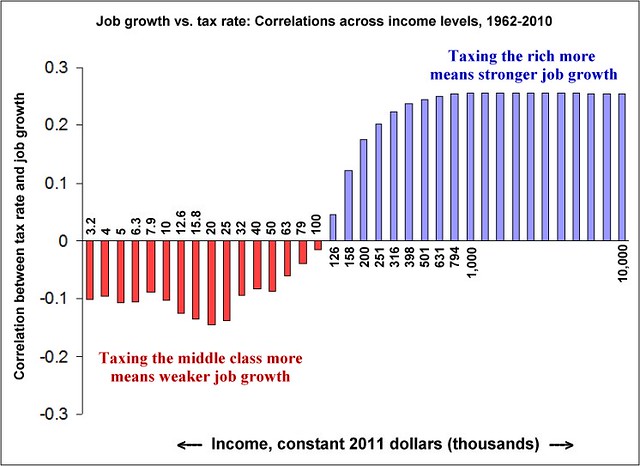
The first thing to notice is that while the GDP chart has data back to 1947, the job growth chart only goes back to 1962. That's because the Bureau of Labor Statistics didn't begin collecting data on nonfarm payrolls until 1961. (I considered using unemployment data instead of payroll data, but the definition of "unemployed" has changed so often that I figured it would be a lot trickier. The payroll number is rock solid, by contrast).
What we're looking at here is the year-over-year difference in nonfarm payroll for each year, so 1962 is the first year for which we can compute that number. In most years that difference is positive (job growth) but in recession years it's negative. Also, we have to account for the increasing population over time, so we divide the year-over-year payroll change by the midyear population of the US, which we get from the Census Bureau. That gives us annual job growth (or shrinkage) as a fraction of the population.
We then proceed as described in my earlier diary. For each income level (as defined logarithmically, starting with 103.5 or $3162 and ending with 107, or $10 million), we compute the correlation between job growth and tax rate. In the comments to the previous diary, some people were a bit confused on this point, so here's another graph that might explain it better. This is a scatterplot between tax rate and job growth for people making $20,000 in constant 2011 dollars, for every year between 1962 and 2010.
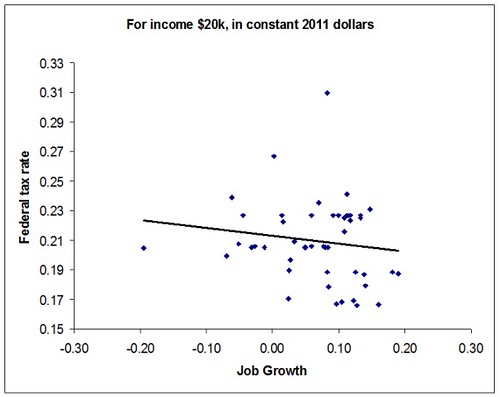
As you can see, there's a lot of scatter here, but the overall trend is downward: for people at this income level, higher taxes are correlated with lower job growth. Now let's do the same thing for people making $1 million in constant 2011 dollars, for the same 49 years:
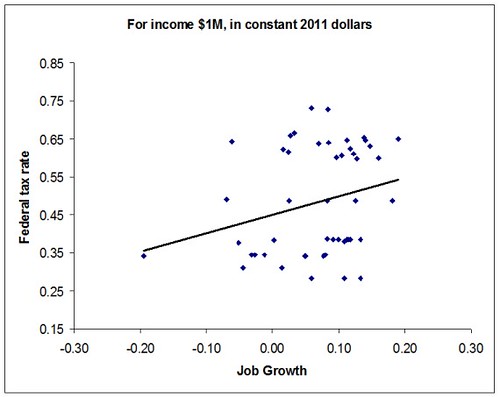
Again, there's a lot of scatter, but this time the correlation slope is positive: a higher tax rate on millionaires is associated with stronger job growth. You do that for every income level and plot the correlations, and you get the bar graph at the top of the page.
Why does this happen?
In my previous diary, I explained GDP growth and taxes in Keynesian terms. This time let's look at it from a more ground-eye view. Let's say you own a hardware store and have 10 employees. You're a job creator. Let's say your store has a really good year: sales are way up, profits are way up. Your business has a lot of income.
Now what are you going to do with that money? If you leave it in the business, your business income is high. If, as the business owner, you take it out in salary for yourself, your personal income is high. If the tax rate is sharply progressive, that high income (whether it's personal or business) will be taxed at a high rate. So you have a strong incentive to do neither one of those things.
But there is a third option: you can leave it in the business, and arrange things so that your business income is lower. You do that by growing the business. You expand: buy a new store, build an addition on your current store, or expand your hours. Doing any of that costs money, but it's money you otherwise would have paid in taxes. By using that to expand the business, you not only avoid the tax, you make your business grow. And you add jobs.
If the tax rate is highly progressive, that's where your incentive lies: in good times, expand the business and hire more.
But if the tax rate isn't highly progressive, you have much less incentive to expand the business, and more incentive to take the money out of the business for your own personal income.
A bit about statistics and significance
You can skip this part if you're not a math type.
For the job growth chart, we have 49 years of data. For a one-tailed test where N=49, the 90% confidence level occurs when correlation coefficient of r>.1863 (or for a two-tailed test, where |r|>.1863); in these data, we achieve that 90% level of confidence at all income levels above $220k per year.
For a one-tailed test where N=49, the 95% confidence level occurs when correlation coefficient of r>.2377 (or for a two-tailed test, where |r|>.2377); in these data, we achieve that 95% level of confidence at all income levels above $350k per year.
For the GDP growth chart, we have 64 years of data. For a one-tailed test where N=64, the 90% confidence level occurs when correlation coefficient of r>.1623 (or for a two-tailed test, where |r|>.1623); in these data, we achieve that 90% level of confidence at all income levels above $600k per year.
For a one-tailed test where N=64, the 95% confidence level occurs when correlation coefficient of r>.2074 (or for a two-tailed test, where |r|>.2074); in these data, we do not achieve that 95% level at any income level.
In other words, the correlation between job growth and progressive taxation is even stronger than the correlation between GDP growth and progressive taxation.

