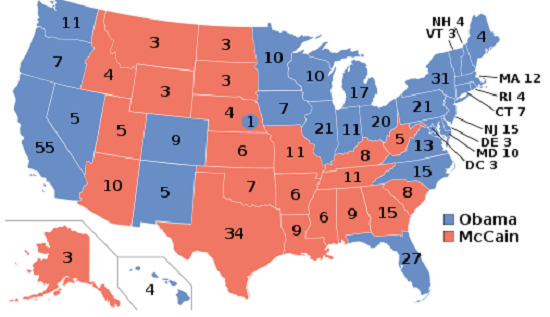
Four years ago, the final electoral map in the race for the White House wound up looking markedly different than the one that resulted from the 2000 and 2004 presidential elections that elevated (and then returned) George W. Bush to the White House.
The "Obama coalition" of states propelled him to the presidency in an electoral college landslide, as the Democrat tallied 365 electoral votes with Republican John McCain able to secure only 173 electoral votes. Embedded in that coalition were states that Democrats had not been able to coax into their column since Bill Clinton was president. In the case of three states (Virginia, Indiana and North Carolina), the Democratic losing streak ran back to well before the Clinton presidency.
It's four years later, and quite a bit has changed. It is only a remote possibility (and that might be overselling it) that the map will look exactly the same as it did in 2008. Given public pessimism about the economy, and approval ratings that have been sub-50 for most of the past 12-18 months, one would expect that some of Obama's comfortable 2008 cushion will be eroded in 2012.
And while there are states that look considerably tougher for the president than they did in 2008, there are also a handful of states that have not been in the Democratic column in the past 15 years, but could conceivably fall their way in 2012.
The map, most assuredly, is changing.
To understand the contours of the new electoral math, let's break up the 51 presidential contests into three groups: the Obama/Democratic "base states" (states won by Democrats in all three elections), the Republican "base states" (states won by Republicans in all three elections), and the "Obama coalition" states (states lost by either Kerry or Gore, but won by Obama in 2008).
For ease in remembering which states belong to each category, you may peruse this handy reminder:
Obama/Democratic base states (242 electoral votes): California (55 EVs), Connecticut (7), Delaware (3), District of Columbia (3), Hawaii (4), Illinois (20), Maine (4), Maryland (10), Massachusetts (11), Michigan (16), Minnesota (10), New Jersey (14), New York (29), Oregon (7), Pennsylvania (20), Rhode Island (4), Vermont (3), Washington (12), Wisconsin (10)
Republican base states (180 electoral votes): Alabama (9 EVs), Alaska (3), Arizona (11), Arkansas (6), Georgia (16), Idaho (4), Kansas (6), Kentucky (8), Louisiana (8), Mississippi (6), Missouri (10), Montana (3), Nebraska (5*), North Dakota (3), Oklahoma (7), South Carolina (9), South Dakota (3), Tennessee (11), Texas (38), Utah (6), West Virginia (5), Wyoming (3)
"Obama coalition" states (116 electoral votes): Colorado (9 EVs), Florida (29), Indiana (11), Iowa (6), Nevada (6), New Hampshire (4), New Mexico (5), North Carolina (15), Ohio (18), Virginia (13)
Right away, the more eagle-eyed reader will catch onto something which speaks to a diminution of the Obama electoral landslide: John McCain's electoral vote count grew from 2008. How? Reapportionment. The electoral vote bounty from Texas alone has grown from 32 to 36 as a result of the census. Therefore, John McCain's 173 electoral votes are now 179. Giving him back Nebraska's 2nd district (though the Omaha metro area may well give its support to Barack Obama yet again) gets us to 180 "base" electoral votes for the GOP.
Democrats, meanwhile, are sitting in a comparably superior position, with 242 electoral votes going to them in each of the last three presidential elections. But, as any 4th grade mathematics student could easily tell you, 242 < 270. Therefore, the president cannot be re-elected on his base states alone.
That leaves ten states, tallying 116 electoral votes, which will get a tremendous amount of attention over the next eight months or so. And that is because they have demonstrated the ability to support both parties, and they amount to enough electoral votes to swing the election.
What follows is a listing, from one through ten, of how likely these states are to flip back to the Republicans. This is based on taking the average of the three most recent polls in each state, and then rank ordering them. This is not a perfect method, of course: Indiana has been barely polled at all (only one internal Democratic poll for Joe Donnelly hinted at a presidential result), and to get three polls in Colorado requires going all the way back to February of 2011. But it gives you at least some idea of where things stand in these 10 critical battlegrounds.
Poll performance of the "Obama coalition" states, 2011-2012
1. Indiana: GOP +4.0
2. North Carolina: GOP +2.3
3. Nevada: GOP +1.7
4. Ohio: Obama +0.0
5. Iowa: Obama +1.3
6. Virginia: Obama +2.0
7. Florida: Obama +2.3
8. New Hampshire: Obama +5.0
9. Colorado: Obama +5.0
10. New Mexico: Obama +11.3
That chart gives you an indication of how small shifts in momentum could pay huge dividends in this battle for the White House. If the GOP can pick up the slack to the tune of just 2-3 points, they'd win the White House with a 278-260 electoral college majority, picking off all of the '08 coalition states except for New Hampshire, Colorado, and New Mexico. President Obama, meanwhile, could forge an electoral college majority close to 400 electoral votes with a bit stronger of a wind at his back, because not only would he presumably sweep all the '08 coalition states (with the possible exception of Indiana, but he could conceivably claim states in the GOP column that have had reasonably close polling in this cycle. Some states that fit that bill include Arizona, South Carolina, and even Texas, where a poll earlier this week showed that while Mitt Romney and Rick Santorum had big leads with Lone Star State "likely voters", the margin was five points or less among registered voters.
"The math", quite clearly, looks better for the Democrats than it does for the GOP, since their natural coalition is quite a bit larger than that of the GOP. That would explain why the Republicans (and whomever emerges from their primary) will look to pick off some of those base states. The one they have hammered on the hardest and longest has been Pennsylvania, and a three-poll analysis there shows a reasonably close (Obama +2.3) race there. They also cleaned up in 2010 in Michigan and Wisconsin, but polling released this week makes it seem as if both states are out of reach for the Republicans, as Barack Obama leads Mitt Romney by margins equal to (or even larger than) his 2008 margins of victory.
Plus, as mentioned earlier, there are some states that Republicans have had on lockdown for over a decade that could conceivably flip the other way. Multiple polls have Missouri (three poll average: GOP +2.3), Arizona (three poll average: GOP +3.7) and South Carolina (three poll average: GOP +6.0) within striking distance for the Democrats. Stray polls have even showed hints of a race in states where Democratic presidential candidates rarely both to put up much of a fight. In addition to the aforementioned Texas poll, a November poll by Vanderbilt University had Mitt Romney up by only four points (42-38) over Barack Obama in Tennessee, a state Obama lost by fifteen percent in 2008. Even in West Virginia, where the president has typically suffered from some of his worst approval ratings in any state, a December poll by local pollsters Blankenship enterprises gave Mitt Romney only a seven point lead (45-38).
Even if Obama cannot pick off any McCain '08 states (and, frankly, he is a betting favorite in exactly none of them), the combination of those core Democratic states and the bulk of those '08 states would push him over the top. Republicans are likely to focus on sweeping those states, and picking off one or two of those Democratic base states. They aren't looking good to do so as we speak, but no one has ever been elected president in February, either.
