Hi all. I've not written a diary for months about anything, and I thought it was about time I did so. The last Arctic sea ice diary I did was at the end of August 2011. Then the gloom of the fall-to-winter failing of the light (let's just call it SAD) took away my motivation to do much of anything except "function". Lots of others here do an excellent job of presenting broad-based information on climate change, so I don't think you missed much.
Be that as it may, here's what's been going on up north since August 2011, in one diary.
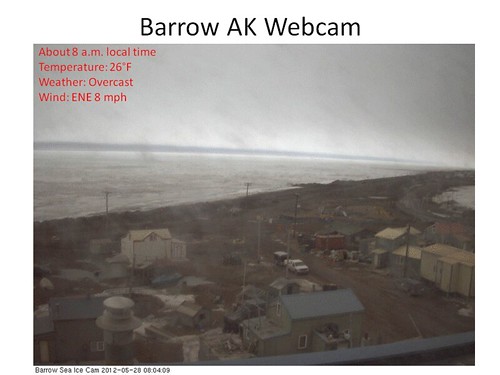
First is the usual picture of a favorite vantage point for assessing Arctic sea ice, the Barrow AK webcam located right at the Arctic Ocean shoreline. This was taken at about 8 a.m. local time on 28 May 2012.
More below the orange Satansquiggle.
Arctic Sea Ice Extent Behavior Since Last Minimum
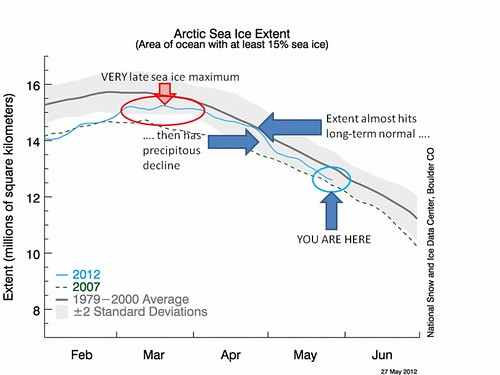
As you may know, Arctic sea ice recovered to some extent in area coverage last winter. The time series below shows the time series from 1 February to 30 June for 2007, the mean for 1979-2000, and for 2012 (through 27 May only). Because of a cold period in the Alaskan sector in March and early April 2012, the ice there didn't begin to retreat until late April. As a result, sea ice extent stayed near its maximum through all of March and only declined slowly thereafter, being almost exactly at the mean 1979-2000 sea ice extent in mid-April. Because the ice that increased last winter's sea ice extent was "young" ice (current year or 1 year old only), once the weather warmed, the ice began to disappear rapidly starting in late April 2012. By 27 May, sea ice extent was near the 2007 value once again.
Current Arctic sea ice extent in context
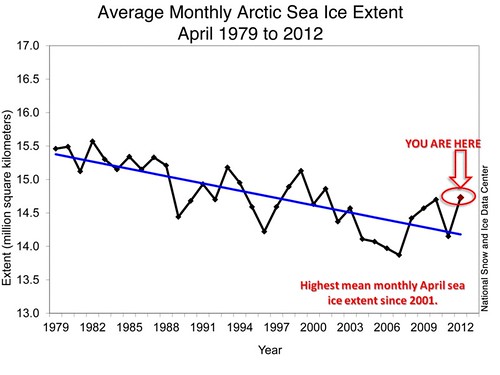
The mean April Arctic sea ice extent since 1979 to the current year can be seen below. While the trend is still downward when accounting for all the data, the April 2012 extent was the highest since 2001.
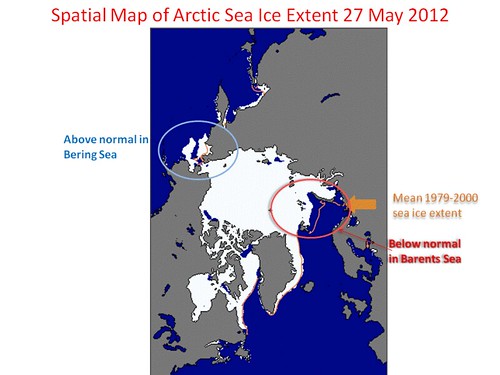
The graphic below shows spatial extent of 15% of more Arctic sea ice coverage on 27 May 2012. The mean 1979-2000 extent is shown with an orange contour, and the current extent in white. Bering Sea extent is still somewhat above normal after a very cold winter, while extent is below normal in the Kara Barents Sea (thank you, radarlady, for the correction!) area north of Eurasia.
As stated above, much of this ice is new and thin (and easily melted or otherwise broken up). This can be inferred from the estimated Arctic sea ice volume over the last 33 years, seen below.
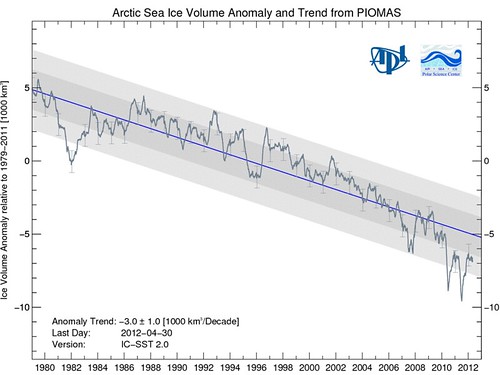
The graphic shows a trend line in dark blue bold (a linear decline of 3000 km3 per decade) and the 95% confidence interval on either side of the trend in darker (1 standard deviation) and lighter (2 standard deviations) gray shading. Error bars on the daily volume (bold gray) are indicated with light gray box and whiskers. While the sea ice extent has not decreased as rapidly since 2007, its total volume has been decreasing at a more rapid rate. Since the volume is the area coverage times the thickness of the ice, such rapid volume decreases can't represent anything other than rapid thinning.
Note that the estimated values of Arctic sea ice volume have been below the decreasing linear trend since mid-2009. There is some evidence that the recent departure from the linear trend may represent a permanent acceleration in the loss of sea ice. This acceleration results from increased Arctic air and sea surface temperatures (SSTs). The increased temperatures are the result of both greenhouse gas concentrations and increased solar radiation being absorbed by the Arctic land and ocean surfaces (decreased snow and ice cover). Additionally, warmer waters have been moved into the Arctic basin by subsurface ocean currents. See this link at Skeptical Science for more on this.
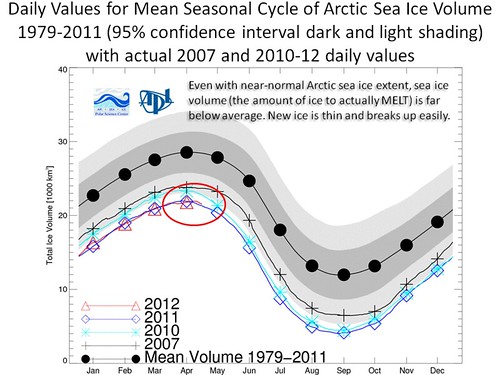
The seasonal cycle of actual sea ice volume, along with the full cycle for 2007, 2010, and 2011 (and through 30 April 2012) is shown below. The 95% confidence interval for the mean seasonal cycle is shaded in gray. The steady decrease in volume from 2007 to the present is also clear in this graphic. Notice how little ice volume there actually is when it hits minimum: what averaged 13,000 cubic km over the last 33 years is now, at minimum, about 4,000 cubic km.
NOAA North Pole webcams launched
The NOAA North Pole webcams were launched this year in April. They survived the budget crunch, at least this time. The picture below is from 15:37 universal time on 27 May 2012.
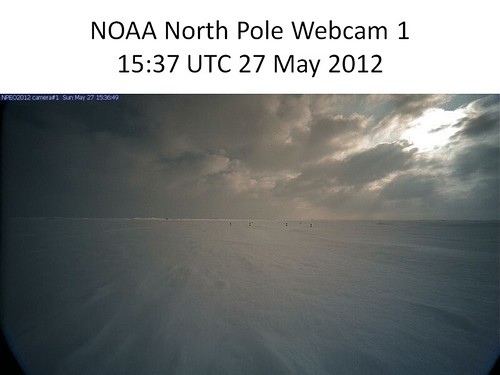
There is some evidence of melting of the snow surface in that it's relatively dull looking (with some new snow blowing across the top). No evidence in the picture exists, however, that any water leads have developed to this point.
What's coming up in Arctic sea ice news
I hope to do a diary at least once per month and more often if news warrants. If I hear of anything climate related but NOT about the Arctic, I'll try to blog that as well.
