The US Geological Survey has discovered acceleration of the rate of sea level rise (SLR) along the coastline from Cape Hatteras to Boston, likely caused by the weakening of the Atlantic Meridional Overturning Circulation (AMOC) popularly known as the weakening of the Gulf Stream.
Our analyses support a recent acceleration of SLR on ~ 1,000 km of the east coast of North America north of Cape Hatteras. This hotspot is consistent with SLR associated with a slowdown of AMOC.
The east coast's average rate of SLR from 1970 to 2010 was 2 to 3.7 millimeters/year, 3 to 4 times faster than the global rate of of 0.6 to 1 mm/y. The most likely cause of this sea level rise hotspot on the east coast is the increased rate of melting of Greenland's ice cap, triggered by anthropogenic global warming. The fresh melt water from Greenland reduces the salinity and density of the water in the north Atlantic and Labrador sea, reducing the rate of formation of north Atlantic deep water and slowing the Gulf Stream. When the Gulf Stream slows, the sea level rises on the east coast of the United States north of Cape Hatteras.
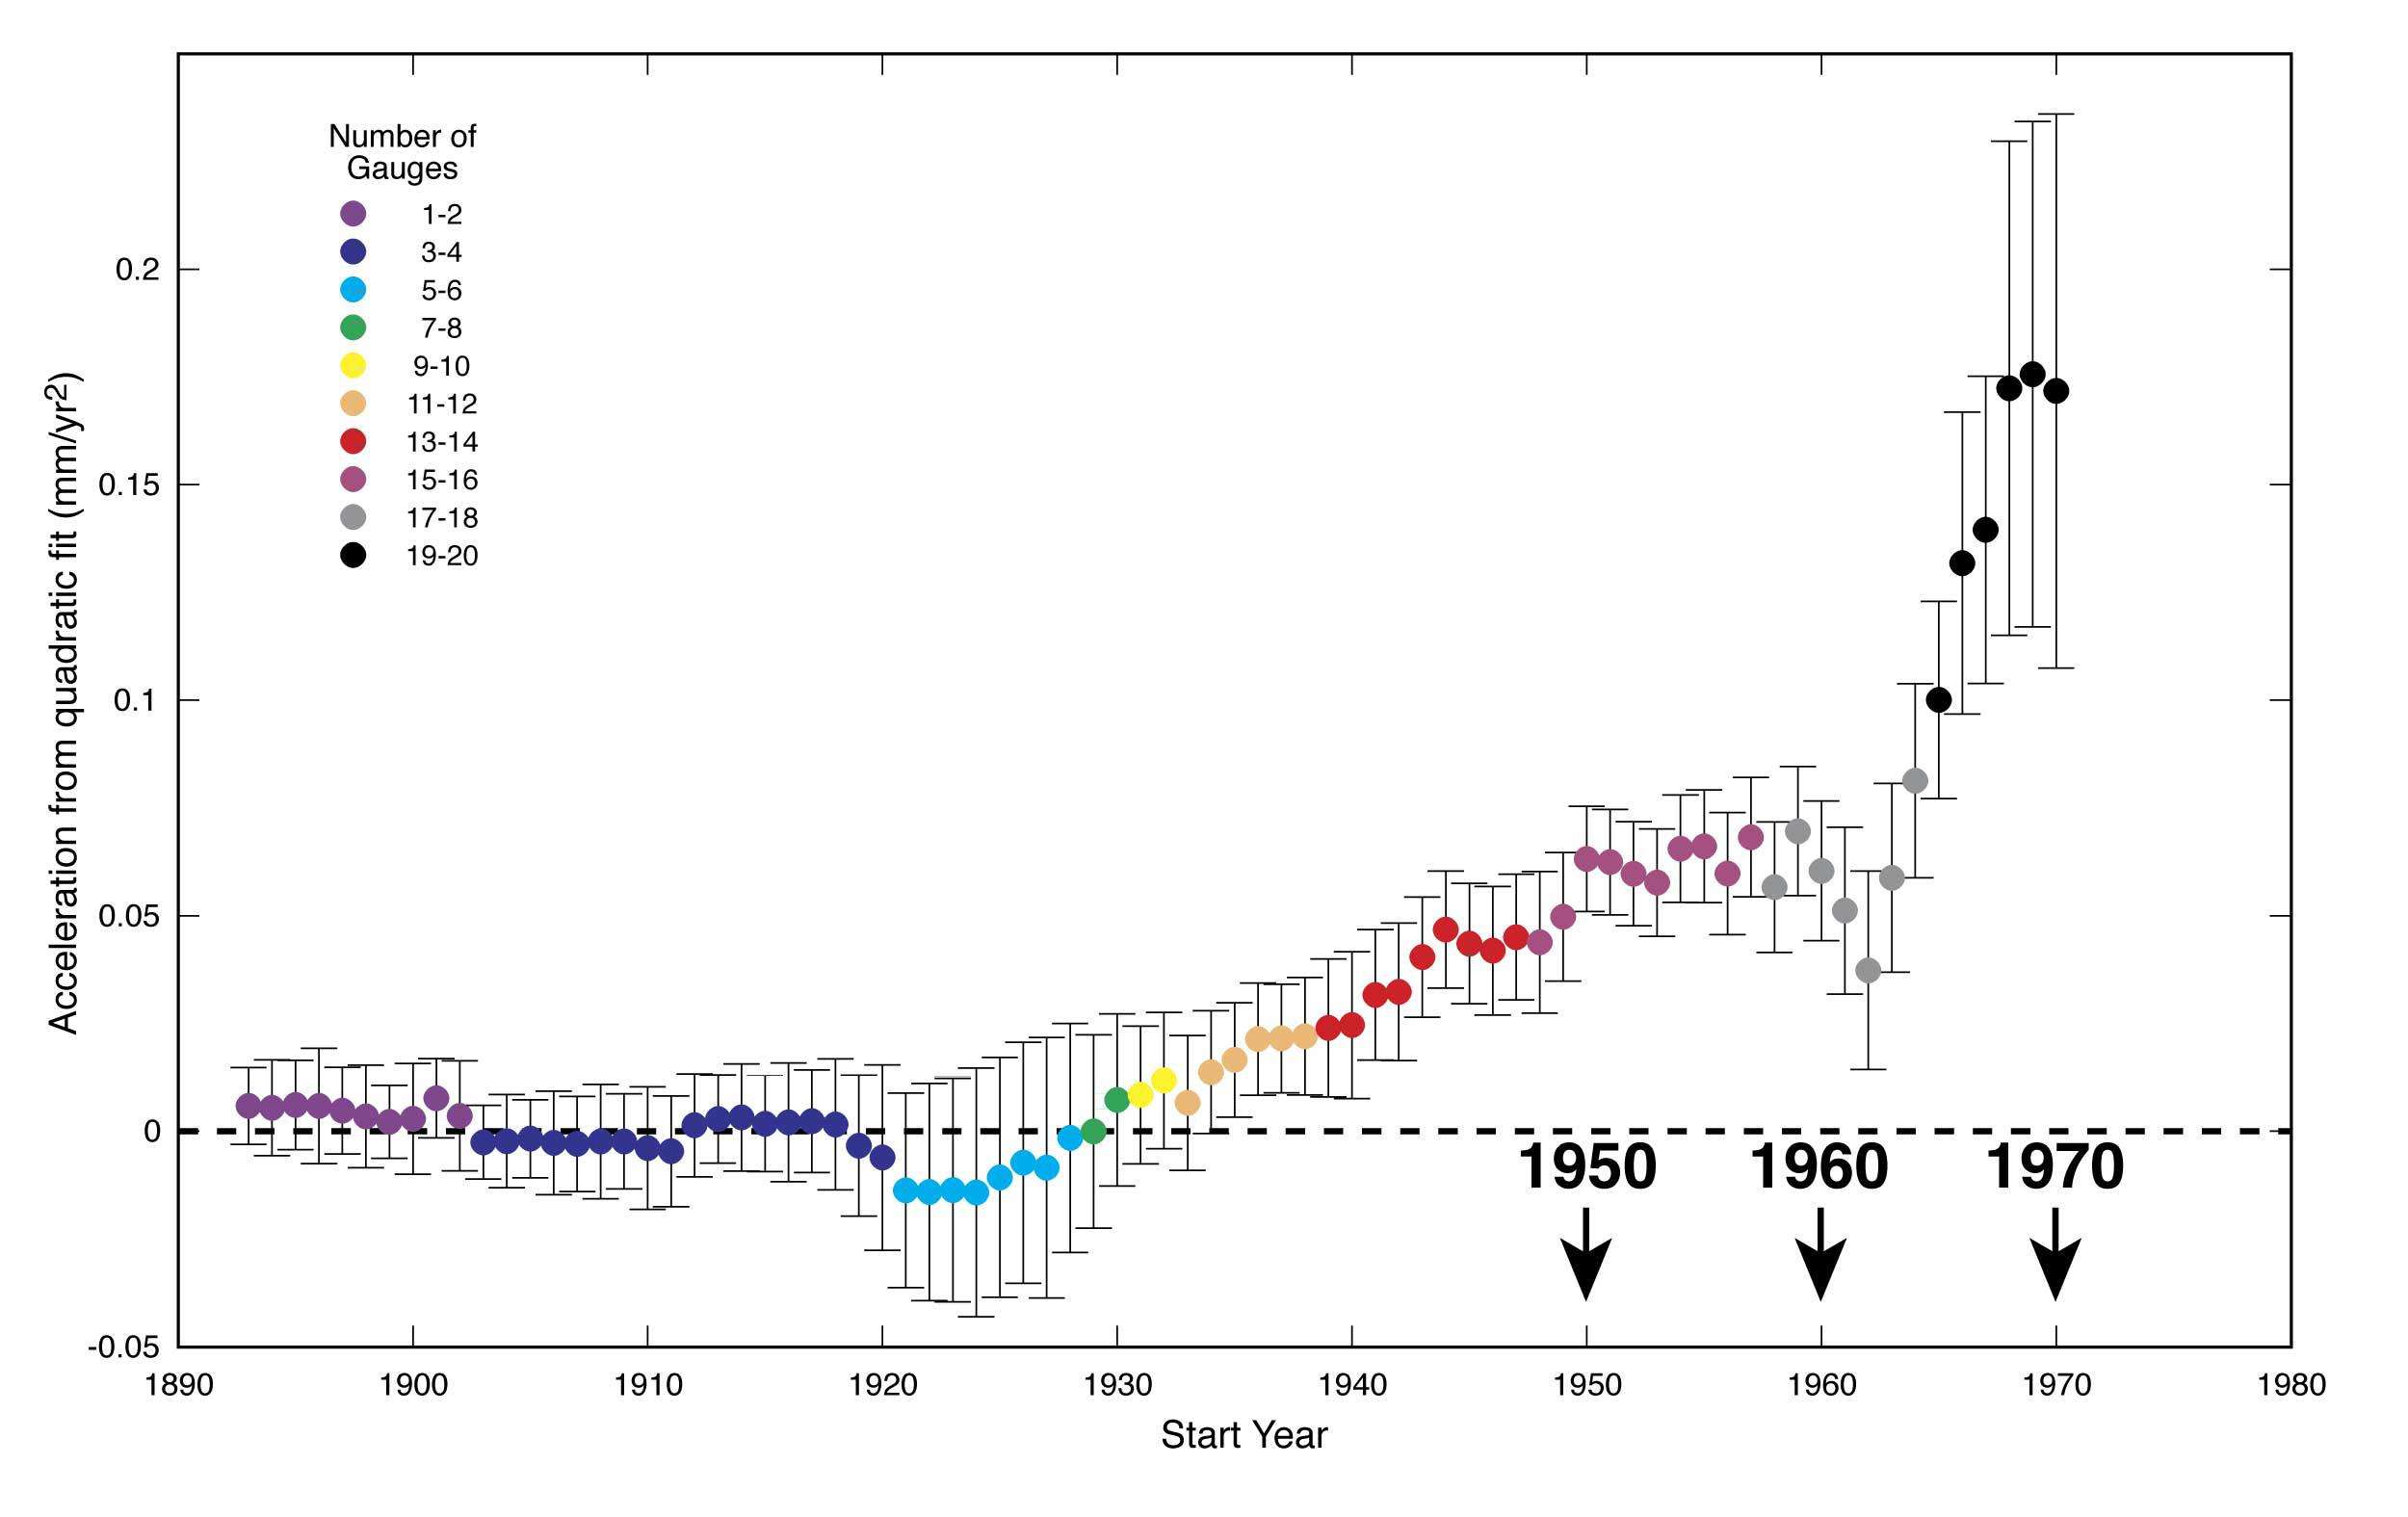 Supplementary Figure S4. Hotspot-averaged acceleration (from quadratic fits of tide gauge data) versus variable time series lengths. Note that the x axis is the start year for the regression calculations, not the midpoint date associated with the average acceleration estimates elsewhere in this work. All regressions end with year 2009. Color coding indicates the number of hotspot gauges included in the average, ±2σ confidence intervals. Simply speaking, sea level rise began to accelerate rapidly around 1970.
The USGS press release highlights the vulnerability of this highly developed coast accelerated sea level rise driven by warming caused by human emissions of greenhouse gases. The costs of sea level rise on the east coast will be enormous.
Based on data and analyses included in the report, if global temperatures continue to rise, rates of sea level rise in this area are expected to continue increasing.
The report shows that the sea-level rise hotspot is consistent with the slowing of Atlantic Ocean circulation. Models show this change in circulation may be tied to changes in water temperature, salinity and density in the subpolar north Atlantic.
"Many people mistakenly think that the rate of sea level rise is the same everywhere as glaciers and ice caps melt, increasing the volume of ocean water, but other effects can be as large or larger than the so-called 'eustatic' rise," said USGS Director Marcia McNutt. "As demonstrated in this study, regional oceanographic contributions must be taken into account in planning for what happens to coastal property."
Though global sea level has been projected to rise roughly two-to-three feet or more by the end of the 21st century, it will not climb at the same rate at every location. Differences in land movements, strength of ocean currents, water temperatures, and salinity can cause regional and local highs and lows in sea level.
"Cities in the hotspot, like Norfolk, New York, and Boston already experience damaging floods during relatively low intensity storms," said Dr. Asbury (Abby) Sallenger, USGS oceanographer and project lead. "Ongoing accelerated sea level rise in the hotspot will make coastal cities and surrounding areas increasingly vulnerable to flooding by adding to the height that storm surge and breaking waves reach on the coast."
The science team found a direct correlation of sea level rise with the amount of Greenland ice melt when they added a 12 year lag time for the response of the Gulf Stream.
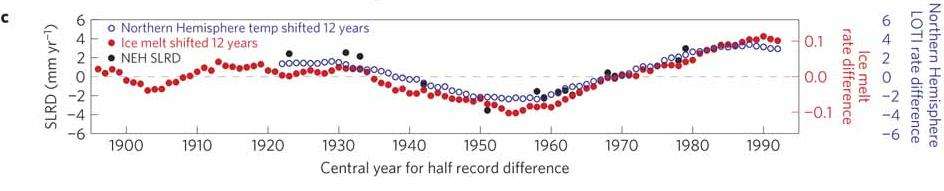
In addition to the warming effects of temperature, ice melt could freshen surface water, further reducing its buoyancy, for example, in the deepwater formation area south of Greenland. The authors of ref. 18 detected acceleration of Greenland ice sheet (GIS) melt of 21.9±1 Gt yr−2 that began in the early 1990s, roughly coincident with NEH initiation. Investigators have developed indexes for GIS melt through multiple regression of forcing parameters with dependent estimates of melt from satellite measurements over the past few decades19, 20, 21. We use the recent index of ref. 19 (see equation (1) and Supplementary Information) based on Greenland coastal summer temperatures and winter NAO. (Seawater temperature is not included and may be important to GIS melt from below22, 23.) With a 12-yr lag, ice melt rate differences explained 84% of the variance of SLRDs (Fig. 4b,c and Supplementary Fig. S9A; r2=0.84; lag=12 yr). The relatively short lag is consistent with model projections24. The good agreement results mostly from the Greenland temperature term (compare correlation for ice melt to correlation for Greenland temperatures alone).
