I just returned from an inspiring day-long immersion at the National Clean
Energy Summit 5.0 in Las Vegas. It was a veritable barrage of intelligence on everything from the latest in Smart Grid and EV technologies to new renewable energy and energy efficiency deployments (you can scan the highlights on my #NCES2012 feed). It featured the top clean energy thinkers in the U.S. – Sen. Harry Reid (check out his terrific opening speech), Elon Musk, John Podesta, Ken Salazar, Air Force head Michael Donley, FedEx CEO Fred Smith, Bill Clinton, and host of business and technology leaders.
One thing is now certain in 2012. We have the technology to solve climate change. Not only that… but the implementation of these solutions represents one of the greatest job growth opportunities in U.S. history. Bill Clinton cited a great fact – for a typical $1B coal plant only about 870 jobs are created. A comparable solar project offers 1900 jobs, and a similar investment in energy efficiency, a whopping 7000 jobs. In just the past four years over 1 million jobs have been created in the energy efficiency sector, this despite a hostile political environment in Washington and a massive economic recession.
The numbers game has changed. Solar and Wind power is now competitive with coal power in much of the United States, and the old thinking about the Grid not being able to handle intermittent sources of renewable power has proven to be overblown. Many believe the grid can currently handle a 1/3 renewable mix with no substantial grid upgrades, and using conventional grid technologies available today NREL estimates the U.S. grid could “easily handle” an 80% mix of renewable energy by mid-century.
What does this mean for climate change? Energy production for buildings and industrial processes are the largest source of climate-forcing carbon emissions – roughly 45% worldwide.
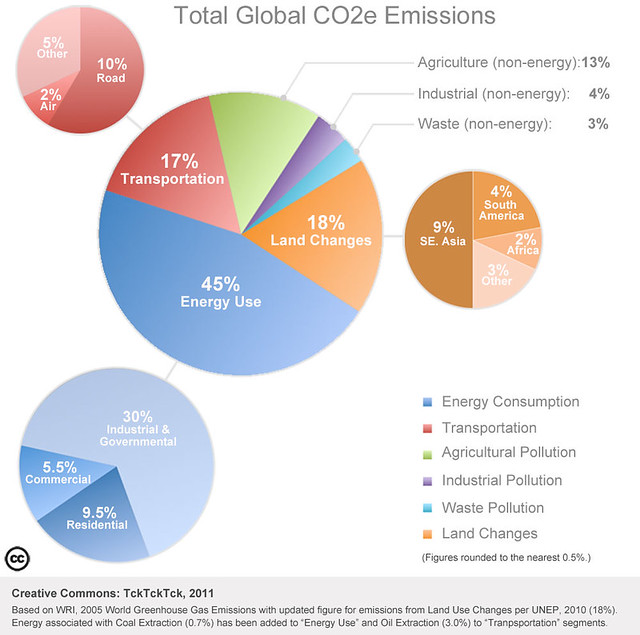
According to the EIA, 40% of these emissions are directly related to electricity generation, or 18% of TOTAL global CO2 emissions.
Going to an 80% renewable mix would eliminate 14% of total human-made greenhouse gases. Through two additional measures -- cutting fuel use in half for heating and for transportation through efficiency measures -- we could eliminate more than a third of TOTAL global CO2. That would take us down to 1980 emissions levels.
And if you doubt there is enough solar and wind power available to meet our growing energy demands, we did some number crunching for you. Using comprehensive data sets from NREL, the U.S. Energy Information Administration, CAIT 8.0, UN Energy Statistics Database, CIA World Factbook, and many others (see below) we demonstrate how we can meet our projected energy demand many times over – Brazil 67 times over, Canada 68 times over, the U.S. 5 times over, Russia 20 times over, China 2 times over, Australia 54 times over.
In our Power Potential infographic below, we compare each country’s capacity for clean, renewable electricity generation — wind (light blue) and solar (dark blue) at a 50% deployment using current, proven technologies. This is compared with current (2008) electricity demand and projected electricity demand by 2035 per OECD, resulting in a “power factor” — the number of times a country could potentially meet or exceed its projected electricity demand. The magenta bars indicate current, total “renewable” electricity production. Here are the top 25 nations, ranked in order of wind and solar potential:

To learn about how each compares, both in terms of climate impacts and clean energy solutions, check out the interactive map at the tcktcktckwebsite.
SOURCES
1. CO2e Emissions per Capita. Carbon Dioxide Equivalent (CO2e) emissions figures are based on 2005 data indexed in the World Resources Institute database CAIT 8.0. The 2005 data set breaks out emissions specifically from land use changes such as deforestation, as well as primary sources of emissions — energy, industry, agriculture, & waste. It does not include emissions from international bunkers (marine shipping) and factors in only Carbon Dioxide, Methane, and Nitrous Oxide.
2. Climate Vulnerability. The country-by-country climate impact assessments are provided by DARA International, whose 2010 Climate Vulnerability Monitor (PDF) has compiled data on the impacts of climate change for 4 categories — human health, home loss, extreme weather, and economic stress — both current and projected (to 2030). The size of the circle denotes the scale of impact and the color denotes intensity, red being the most severe.
3. Current Electricity Use. Current total electricity consumption is taken primarily from 2005 CIA World Factbook. More complete data for the top 12 nations is taken from the U.S. Energy Information Administration, with the exception of China (the #1 consumer) cited from Bloomberg.
4. Projected Energy Use. The 2011 World Energy Outlook forecasts future electricity demand for both OECD countries (developed nations who are members of the Organisation for Economic Co-operation and Development) and non-OECD countries. OECD countries assume a 32% growth in electricity generation by 2035. Non-OECD countries vary by region — 64% for Latin America, 108% for Africa, 44% for Russia & Eastern Europe, 166% for China, and 130% for all other Asian nations.
5. Current Percentage Renewables. From the UN Energy Statistics Database (2006).
6. Solar Energy Potential. Solar potential is based on the International Clean Energy Analysis gateway (ICEA) which uses 2008 NREL (U.S. National Renewable Energy Lab) data to determine total solar energy potential per year as a function of land area per solar class, assuming a conservative 10% conversion efficiency on available, productive land. For the Tck Climate Guide, we use a 50% deployment of available, productive land as a benchmark.
7. Wind Energy Potential. Wind potential is based on the International Clean Energy Analysis gateway (ICEA) which uses high resolution datasets produced by the NREL (USA), Risø DTU National Laboratory (Denmark), the National Institute for Space Research (Brazil), and the Canadian Wind Energy Association. Lower resolution data for other countries is sourced from the U.S. National Center for Atmospheric Research. The result presented is available land area (km2) by country for class 3-7 winds at 50m above ground. Estimating 5 MW per km2 at a 25% conversion efficiency we derive total potential wind energy per year. NOTE: the American Wind Energy Association (AWEA) now uses 5 MW per km2 with a 30% conversion at 80m above ground based on new, more accurate mapping for the United States, but as this higher resolution data is not yet available in most countries the Tck Climate Guide uses the more conservative estimate, again with a 50% deployment of available, productive land.
8. Renewable Power Factor. The last field in the chart displays the number of times a country can meet its projected energy demand for 2035 (less current renewables) solely through it’s wind and/or solar power. In the case of South Africa, with a projected electricity demand of approximately 504,000 gigawatt-hours, the country could power itself four times over, just through a 50% deployment of solar resources using current technologies.
 Karl Burkart is the Director of Digital Campaigns at TckTckTck and the Green Tech blogger at Mother Nature Network.

