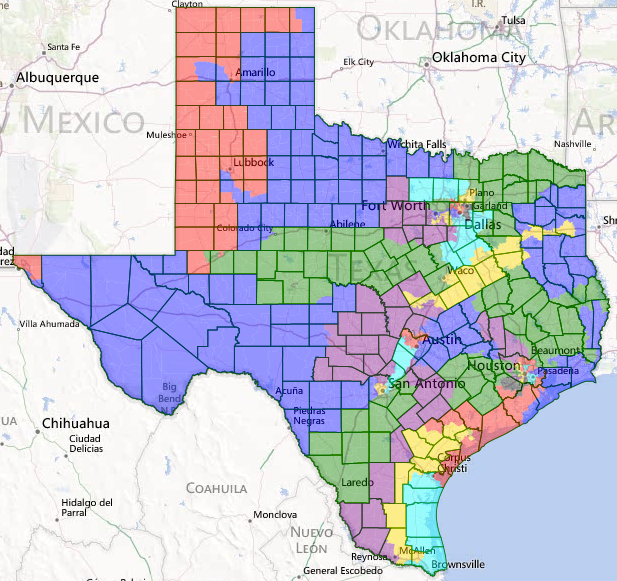
Everyone as Daily Kos Elections knows that I've utilized Dave's App a good number of times to butcher my great state into a a bunch of beautiful Elgin BBQ sausages and barbacoa-lite fajita strips.
I dont think I'd ever quite contented myself until a few weeks ago when a few ideas got stuck in my head of which I hadn't yet thought. With all these new ideas swirling in my head, I went to work combining them with my old prescriptions about the way a map in Texas should be drawn (with due consideration given to a few requests by a Republican friend from RRH that didn't impact - and actually, in fact, aided - the quality of the Democratic districts, such as keeping the Dallas area Park Cities in a Republican-held district) to create what I now view as my masterpiece.
Below the fold I present a lot of information. In addition to the standard fare (pictures, descriptions, voting age and total population racial demographics, partisanship, etc.) I estimate other metrics which I view as important for the holistic picture. As such, a few moments will be taken to explain the assumptions in my modeling.
This diary has been posted to DK Elections, an official Daily Kos sub-site. Please read the DKE Mission Statement. Our focus is on electoral politics rather than policy or preference. Welcome aboard!
Below each district I include multiple data points:
1. The "all population" racial/ethnic breakdown, which is easily ascertained through Dave's App. This is useful insofar as it can point toward future trends and the strength of that trend.
2. The "voting age population" racial/ethnic breakdown, also simply transcribed from the App itself.
3. An "electorate" breakdown, which attempts to model what the electorate is after you remove those who are not (yet) citizens but which does not factor in turnout disparities. This metric is easily derived from two things: A) Latino citizenship is easily measurable, though imperfectly so, through Spanish Surname Voter Registration (SSVR) percentage and B) the assumption that the Asian population is significant non-citizen, so a heavy discount is placed on their share.
By holding the SSVR percentage steady (because that's the percentage that they are in the electorate), you can apportion the remainder (I.E. 100%-SSVR%) to other groups given their respective portions in society (as seen through VAP, given that those under 18 are not part of the electorate). Keep in mind that I'm placing a heavy discount on the Asian population. I wasn't able to find data on their rate of citizenship in Texas, so my model assumes that only half are citizens. Coincidentally, this seems to (after also accounting for their low turnout) pop up with roughly equivalent numbers to 2012 Texas turnout models, so I feel comfortable using this baseline. Besides, because of their very small share, changing it either up or down to 60% or 40% (within the range of reason) does not change the racial breakdowns for any race more than .2% (I.E. negligible).
Let's use District 2 as an example so that you can see what I'm getting at here. SSVR is 17.7%, so the balance is 82.3%. The rest of the racial/ethnic breakdown at VAP level is 36.1% Anglo, 15.3% African American, 8.8% Asian American (prior to adjustment, 4.4% subsequently) and 1.4% other. Excluding Hispanic Americans, the percentage breakdown normalized to 100% is 63.1% Anglo, 26.7% Af. Am., 7.7% As. Am. (with the penalty applied) and 2.4% Other. The 82.3% left over in excess of the SSVR is apportioned along these lines, such that in this case, 51.9% of the district's eligible population is Anglo, 22.0% is Af. Am., 17.7% (the SSVR rate) is His. Am., 6.3% is As. Am., and 2.0% is other.
Always remember that SSVR is equal to the Hispanic percentage in this "electorate" metric.
4. A "turnout modeled electorate," which takes the previous metric a step further by accounting for turnout disparities between and among different racial and ethnic groups. As a baseline, I use 50% turnout among both Hispanics and Asian Americans, which is typical throughout the state, but adjust this given the specific county data presented in the link above for certain districts.
Usually the adjustment is up (55% in San Antonio and Fort Worth based districts, 60% in Austin based districts for Hispanics, and 60% in Austin based districts for Asians), whereas sometimes it is taken down a notch (dismal Hispanic turnout in Corpus Christi for instance, dings the 27th down to 45% for that group). White and black turnout is maintained at 75% and 70% except for one place each: Tarrant County's AA community is bumped to 75% and Austin's white heavy districts are bumped to 80%. This, again, is warranted given the data that we have.
5. Assumed primary electorates are algo given based on assumptions in the minority vote shares, which I hold roughly steady (though with some variation depending on the area). This allows the white vote to vary depending on the Obama vote per district. I.E. If Af. Ams. vote 95% for the Democrat and all other minorities 65% for the Democrat (keep in mind that in most places, Texas Hispanics are more conservative than the nationwide ethnic group), that means that Af. Ams. make up x% of the Democratic vote share and other minorities each x% of the Democratic vote share. Whites, then, have to make up the difference to get Democrats to whatever share they've gotten.
Sometimes this results in some odd results, such as Democrats getting an estimated 40% of the white vote in some places outside of Austin. At first I thought this was odd, but then I realized that it wasn't that much of an impact on the overall white vote given that almost all of the districts are low turnout, substantially minority districts. The overall white vote is almost entirely determined by the uniformly white and Republican districts that I'm not including in this diary, not the few districts where Democrats are able to get good shares of the white vote. The estimated share that each racial and ethnic group contributes in the general election to each party's coalition is assumed to be the rough equivalent to their primary racial/ethnic breakdown.
African Americans I've notched as giving 95% across the board, whereas Hispanic and Asian Americans see some variation. Asians in Houston, given the overwhelming share of Indian Americans and their overwhelming Democratic nature, I've slated as giving 85% to Democrats. Austin based districts, given their overwhelming share of Vietnamese Americans (who are known for their relative conservatism for an Asian subgroup), I've slated as giving only 60% to Democrats. All other districts are assigned a 65% share.
Hispanic districts are also assigned a baseline of 65%, but there are two exceptions: A) Austin based districts, depending on the percent of Hispanics contained in that region within the district itself, are variable upwards. The 25th is assigned 75%, given that it has a small share outside the region that is likely to be more in line with statewide patterns, and the 35th is assigned 80%, given that it is entirely within the Austin area. Districts based in the Valley, El Paso, and/or San Antonio are also slightly higher at 70% - in line with typical Democratic performance.
6. A "democratic minimum" score, which is derived by varying the democratic performance from the above metric among whites only. Adding together the shares provided by minorities with the above numbers to only 20% of the white vote (the state baseline at this point, frankly, outside of very specific examples), arrives at a specific number which can reasonably be assumed to be a percent that no Democrat is able to sink beneath. Districts which contain portions of the Austin area, depending on how much they rely on the Austin area for their white population, are adjusted upwards (21st to 30%, 25th at 25%, and the 35th at 40%). This metric, along with the 2008 and 2012 (using Stephen Wolf's method for estimation) presidential, average Democratic performances, and PVI, will be used holistically (along with demographics, ofcourse, which can dictate the relative flexibility or inflexibility of a district's voting pattern given racial polarization in Texas) to arrive at safety ratings. This should be viewed strictly as a Democratic nightmare scenario a la 2010. The presidential numbers should be much more typical for most districts, unless otherwise noted.
One final note: only racial numbers that are significant for the group will be written, given my desire to remove clutter and keep it as simplistic as possible in presentation. I.E. 8% plus for all groups.
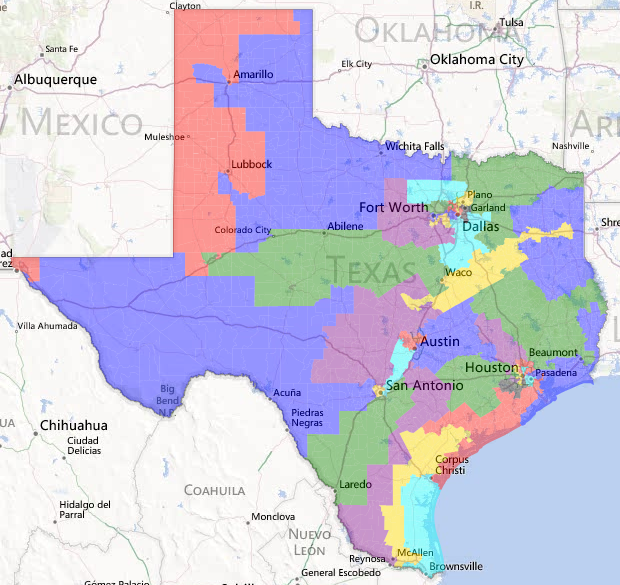
First, a small overview: there are 21 districts which have a reasonably good chance at falling to Democrats, with at least 11 seats that are varying degrees of safe (the same number as currently). There is additionally a 22nd district which Democrats can legitimately compete for, and a 23rd that I believe is winnable if lightning struck and Democrats took
seriously the project of Hispanic turnout.
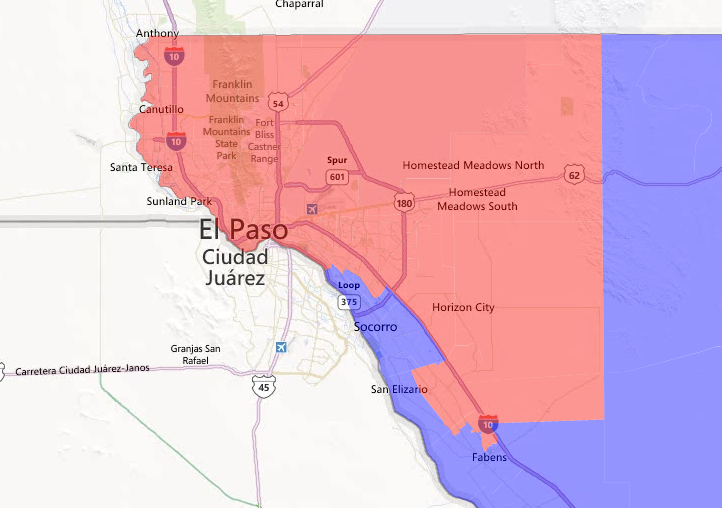 El Paso
16th Beto O'Rourke (D, red)
El Paso
16th Beto O'Rourke (D, red)
Total Population: 14.7W, 80.1H
Voting Age Population: 17.2W, 77.5H
Electorate: 27.4W, 65.0H
Turnout Modeled: 35.4W, 56.0H
Democratic Primary: 27.8W, 8.8B, 60.8H
Republican Primary: 49.2W, 47.4H
Est. Dem. White Share: 50.7%
2008: 64.53 - 34.57 Obama
2012: 64.55 - 35.45 Obama
Average: 60.6 Democrat
PVI: D+12
Dem. Minimum: 53.66
Rating: Safe Democratic
Notes: This is a safely Democratic district that almost certainly counts as a Hispanic ability to elect district, but note that the Hispanic share in the turnout adjusted electorate is not that far above 50%. In academic texts that I've recently read, a few authors have noted that once reason why El Paso has been prone to elect White Democrats is for two reasons: 1) whites are not monolithically Republican here and 2) Hispanics did not compromise a majority of the electorate until the late 1990s. This tracks very well with those assertions. Given this, I would not expect Beto O'Rourke to see a successful ethnically based primary challenge any time soon, even if he may appear weak at first (a la Steve Cohen).
23rd Pete Gallego (D, blue)
Total Population: 25.3W, 68.4H
Voting Age Population: 28.8W, 64.7H
Electorate: 36.9W, 55.6H
Turnout Modeled: 45.8W, 46.1H
Democratic Primary: 24.2W, 10.4B, 62.3H
Republican Primary: 69.0W, 28.6H
Est. Dem. White Share: 27.3W
2008: 52.52 - 47.48 Obama
2012: 50.95 - 49.05 Obama
Average: 51.00 Democrat
Dem. Minimum: 48.36
Rating: Tossup
Notes: Democrats have a good floor here now, given the changes to the district in the San Antonio area (shown below), but they likely still have a low ceiling. Even Ciro did decently given 2010, but Gallego is a far superior candidate and representative than Ciro ever was. Gallego's floor here is probably around 50% even in a bad year, as the amount that he's able to run ahead of the top of the ticket in his home base is significant. In 2012 he ran ahead in all but a handful of precincts district wide, ranging from 1-2% more than Obama to over a net 15% more in west Texas areas.
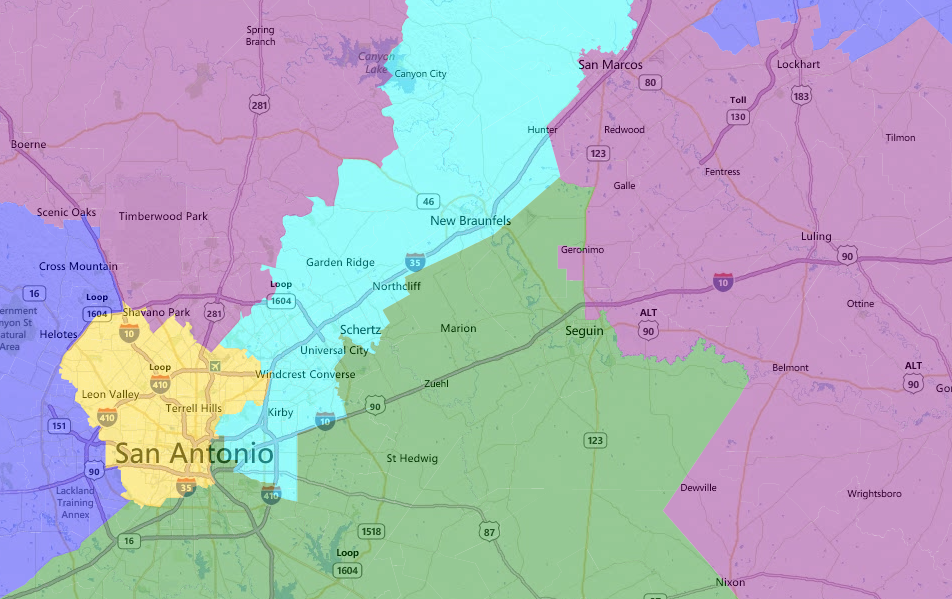 San Antonio
20th Joaquin Castro (D, gold)
San Antonio
20th Joaquin Castro (D, gold)
Total Population: 26.2W, 65.9H
Voting Age Population: 29.8W, 62.1H
Electorate: 40.1W, 50.9H
Turnout Modeled: 47.1W, 43.8H
Democratic Primary: 32.5W, 10.3B, 53.9H
Republican Primary: 66.4W, 30.5H
Est. Dem. White Share: 39.3%
2008: 57.18 - 42.82 Obama
2012: 56.68 - 43.32 Obama
Average: 53.10 Democrat
PVI: D+4
Dem. Minimum: 47.86
Rating: Likely Democratic
Notes: Joaquin is almost certainly safe in this district, but note one thing: whites are the plurality of the turnout electorate. This isn't surprising at all, and given the almost identical district that he currently holds (a few tweaks here and there to aid neighboring districts), I wouldn't be surprised if the electorate that shows up to the ballot box in his real district is also plurality white. This might actually be a problem, given that the floor here is a horrible 47.86 percent. I very much believe that a politician not as capable as Joaquin could lose the district in a wave year, especially now that the African American communities which helped anchor the previous Gonzalez-held 20th are excised into Doggett's district (both in real life and, sort-of, in this map). JC, however, isn't that kind of politician. He's able to turn the grind on to the max, and would destroy most challengers, let alone a top tier GOP recruit.
21st Lamar Smith (R, cyan)
Total Population: 51.4W, 9.7B, 34.0H
Voting Age Population: 56.0W, 9.4B, 30.1H
Electorate: 65.1W, 10.9A, 20.3H
Turnout Modeled: 69.9W, 10.9B, 16.0H
Democratic Primary: 54.2W, 20.1B, 21.7H
Republican Primary: 86.6W, 9.9H
Est. Dem. White Share: 40.0%
2008: 52.93 - 47.07 Obama
2012: 50.36 - 49.64 Obama
Average: 46.90 Democratic
PVI: R+1
Dem. Minimum: 44.63
Rating: conditional, see notes.
Notes: The Democratic white share is so high here only because the most significant bloc of white voters is in Austin (not shown in the picture above, scroll to the picture below). A rating here is candidate specific, as such it should really be called a tossup, but in practice it wouldn't be. It depends on who the parties nominate and where they're from. If Lamar Smith ran here (it has about half of his constituents, and he wouldn't face a primary like he would against Carter in the purple 31st spanning from Austin to San Antonio along the northwest) the seat would go Democratic fairly easily. Lamar's shepherding of PIPA/SOPA is reviled in the Austin area liberal sections of the district. An Austin Hispanic candidate would easily dispatch Smith on that alone. Otherwise, it is geographically contingent. The best outcome would be a San Antonio Democrat against a mid-community Republican (New Braunfels or Dripping Springs), where it would be Lean Democratic. If an Austin Democrat (read that as uber liberal) were the nominee (the only real possibility from here given constituent overlap would be State Rep. Donna Howard), look for the Democratic floor to be achieved against anyone from anywhere except Lamar Smith. I'd want a white moderate self-funder from Hays County (Dripping Springs area), personally, given that minority voters are not part and parcel of this district's ballot box makeup. If Smith didn't run here, State Rep. Paul Workman would easily hold this district for Republicans against almost anyone.
28th Henry Cuellar (D, green)
Total Population: 19.6W, 77.0H
Voting Age Population: 22.6W, 73.7H
Electorate: 31.6W, 63.7H
Turnout Modeled: 40.3W, 54.3H
Democratic Primary: 25.1W, 66.7H
Republican Primary: 60.6W, 37.9H
Est. Dem. White Share: 35.4%
2008: 57.02 - 42.98 Obama
2012: 56.91 - 43.09 Obama
Average: 58.90 Democratic
PVI: D+4
Dem. Minimum: 50.76
Rating: Safe Democratic
Notes: Cuellar, who seems to always draw ire by both Daily Kos front-pagers and DKErs alike because of his relatively conservative viewpoints, would be safe here (so would be any Democrat, frankly). And hey! He's actually given a district that fits his ideologically predispositions (although it isn't as if his current district doesn't... ... snark). I've removed much of San Antonio's black sections in the metrocomm (the area of town in the northeast that is filled with African American military communities) and placed it in the 21st instead. Instead, this district takes in more conservative (but more Hispanic) areas further out like Seguin.
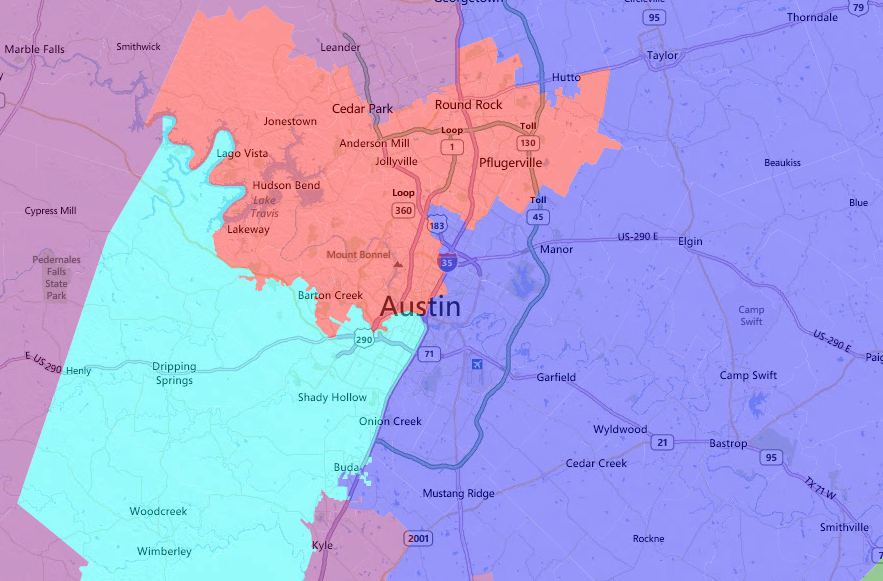 Austin
25th Lloyd Doggett (D, blue)
Austin
25th Lloyd Doggett (D, blue)
Total Population: 37.8W, 14.2B, 44.4H
Voting Age Population: 43.2W, 14.4B, 38.7H
Electorate: 57.3W, 19.1B, 20.2H
Turnout Modeled: 60.9W, 19.0B, 17.2H
Democratic Primary: 41.9W, 31.9B, 22.8H
Republican Primary: 85.6W, 9.9H
Est. Dem. White Share: 38.9%
2008: 58.29 - 41.71 Obama
2012: 54.70 - 45.30 Obama
Average: 56.10 Democratic
PVI: D+4
Dem. Minimum: 48.04
Rating: Likely Democratic
Notes: This would almost certainly count in the court's mind as a coalition district in succession to the old 25th that the D.C. court ruled must exist, as the overall makeup is substantively mixed. This was achieved by uniting the entire Austin area Hispanic community into one cohesive voting bloc within the district in a clean, non-gerrymandered way while preserving Democratic strength in districts elsewhere. Doggett would be safe here, especially given that the district's overall trend is towards Democrats, and Doggett inhabited a district prior to redistricting that gave Obama and Kerry similar scores and that actually gave Bush a victory in '00 (under the 06-12 lines). Connected to this are Bryan/College station and the African American parts of Waller County. Given that no single minority ethnic group dominates, this cannot be tainted as a racial gerrymander, but can easily be defended as a partisan creation.
35th Michael McCaul (R, red)
Total Population: 63.6W, 19.3H, 8.4A
Voting Age Population: 66.7W, 17.1H, 8.4A
Electorate: 76.4W, 9.8H
Turnout Modeled: 80.5W
Democratic Primary: 71.5W, 10.6B, 11.3H
Republican Primary: 91.5W
Est. Dem. White Share: 48.7%
2008: 56.56 - 43.44 Obama
2012: 53.25 - 46.75 Obama
Average: 48.10 Democratic
PVI: D+2
Dem. Minimum: 47.87%
Rating: Lean Democratic
Notes: Do not question the very very high share of the white vote that Democrats get. This is a function of the University and Austin's general liberalness all around. This is the district that would make Michael McCaul sweat, but I think that McCaul might be able to win against any standard fare Democrat in a nasty slug fest. An excellent recruit that Democrats would beg for would be one of three people (in descending order of quality): 1) State Senator Kirk Watson, 2) Austin Mayor Lee Leffingwell, 3) Travis County Judge Sam Biscoe (yes, I know what you're thinking, but if Ann Callis is considered a high quality recruit in Illinois, Biscoe - the institution in Austin that he is - should also be considered high quality). Other than that, I'm not sure who else could beat McCaul in what is ostensibly a Democratically leaning and trending district (I.E. something like CO-6 could happen here).
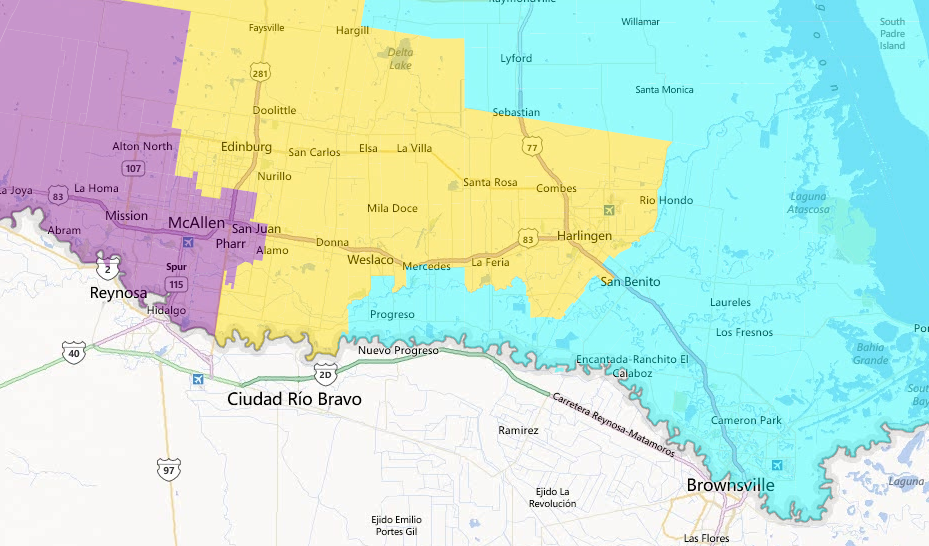 The Valley
15th Ruben Hinojosa (D, gold)
The Valley
15th Ruben Hinojosa (D, gold)
Total Population: 18.1W, 78.8H
Voting Age Population: 21.8W, 74.8H
Electorate: 29.8W, 66.4H
Turnout Modeled: 38.5W, 57.2H
Democratic Primary: 23.8W, 69.7H
Republican Primary: 58.3W, 40.4H
Est. Dem. White Share: 35.6%
2008: 57.02 - 42.98 Obama
2012: 57.92 - 42.08 Obama
Average: 57.00 Democratic
PVI: D+5
Dem. Minimum: 51.48
Rating: Safe Democratic
Notes: Hinojosa has made some motions about retiring in recent years, although he's since backtracked on those seemingly by taking a leading role in the Congressional Hispanic Caucus. I would not be surprised to see him continue on, but at the same time I'd not be surprised to see him continue in office. Should be leave, I do not see a natural successor among any of the State Representatives that share constituents with this district. The mayors of Harlingen (Boswell donated to Cornyn on multiple occasions) and most other high turnout cities are all Republicans, though the mayor of Edinburg Richard Garcia is likely a Democrat (though could very well also be a Republican, I've tried looking through campaign finance report searches for any clues, but can't find anything).
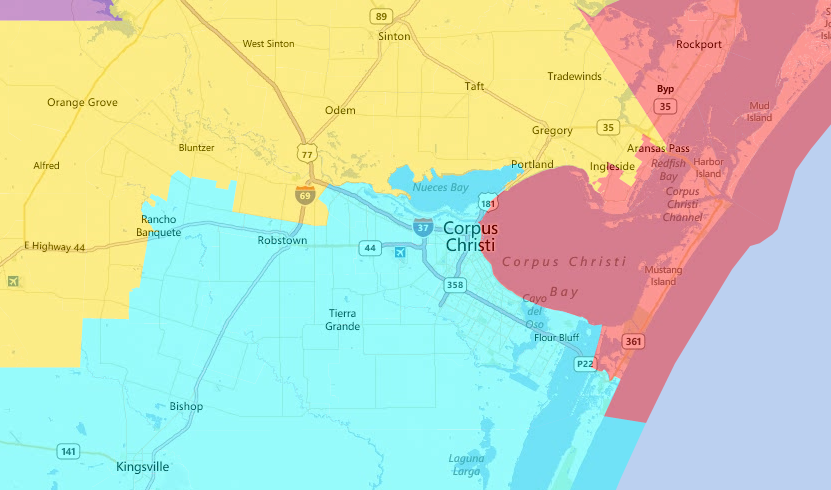
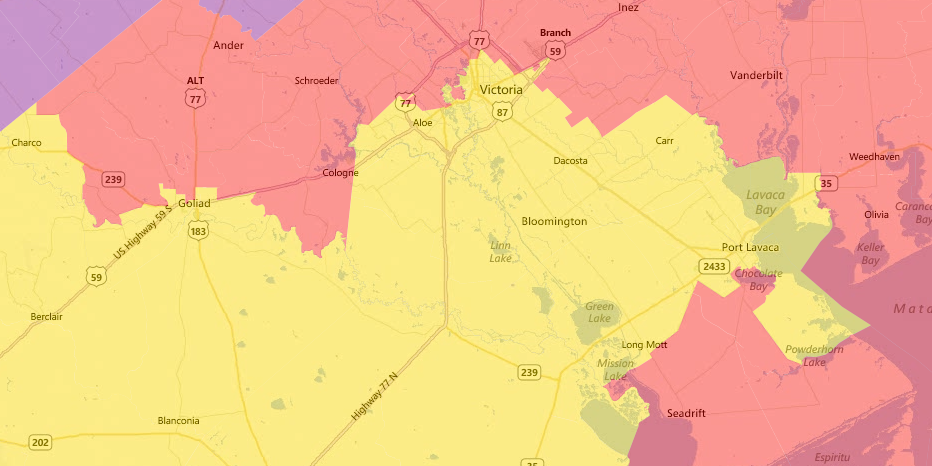
27th Filemon Vela (D, cyan)
Total Population: 19.6W, 76.5H
Voting Age Population: 23.2W, 72.6H
Electorate: 31.7H, 63.5H
Turnout Modeled: 42.8W, 51.5H
Democratic Primary: 29.1W, 62.5H
Republican Primary: 61.5W, 36.5H
Est. Dem. White Share: 39.3%
2008: 57.11 - 42.89 Obama
2012: 58.26 - 41.74 Obama
Average: 57.40 Democratic
PVI: D+5
Dem. Minimum: 49.44
Rating: Likely Democratic
Notes: This district is actually more liberal than the one that Solomon Ortiz held until his defeat in 2010, but only marginally so. That very slight echo of weakness is reflected in two things: 1) that the demographics, although Democratic leaning, are not rock solid because of horrible Hispanic turnout in Nueces as discussed above (see, also, the turnout modeled barely Hispanic majority demographics) and 2) the outcome of those not so wonderful demographics is seen in the Democratic Minimum that is just a smidgeon underneath 50% despite Obama having improved here in 2012 from 2008 (in this case I do not think it a relic of the estimating method, but an actually happening improvement given his improvement throughout the region's counties). Still, though, the trends are bad for Republican here and any win would have to occur in the next few cycles, otherwise they'll be shut out forever.
Personal Note: can we please all stop talking about Vela as if he's a Republican in sheep's clothing? His mother was a very very prominent Democrat who was the first Latina elected mayor of Brownsville. My graduate advisor happened to have profiled her here. He comes from a long line of Democrats, and is certifiably a Democrat himself (albeit a moderate to conservative one), his wife notwithstanding.
34th Open (purple)
Total Population: 20.1W, 76.6H
Voting Age Population: 24.2W, 72.2H
Electorate: 33.8W, 61.9H
Turnout Modeled: 42.8W, 52.3H
Democratic Primary: 30.0W, 62.8H
Republican Primary: 60.8W, 37.7H
Est. Dem. White Share: 40.9%
2008: 58.34 - 41.66 Obama
2012: 58.40 - 41.60 Obama
Average: 58.00 Democratic
PVI: D+6
Dem. Minimum: 49.43
Rating: Likely Democratic
Notes: This district is very similar with regard to safeness as Vela's 27th, and practically everything said there also applies here (read it above). This seat is open, and I think that there are to particularly attractive candidates that could fill a seat like this. San Marcos mayor Daniel Guerrero is an exceptionally personable person. He's very knowledgeable, he's real world, and he'd be a great congressman who could bridge the gap between the increasingly parochial Valley and the rest of the state let alone country. The other option would be State Representative Bobby Guerra from McAllen.
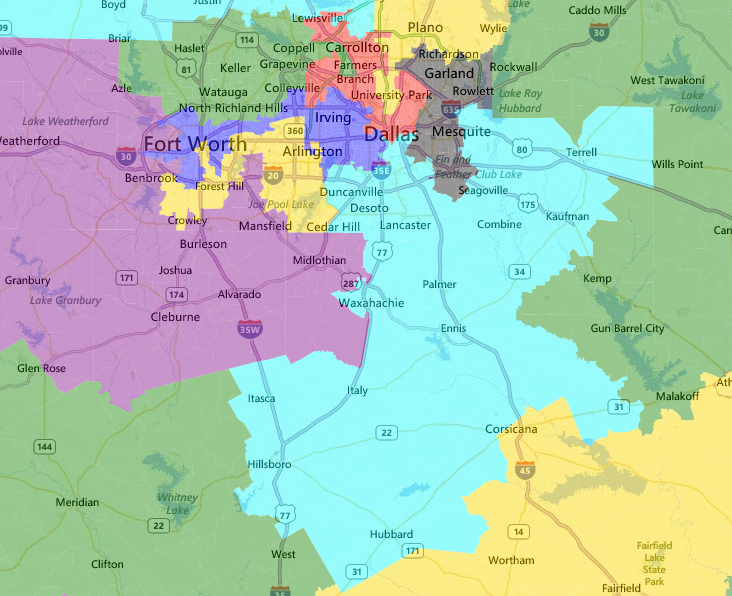 Dallas / Fort Worth
5th Jeb Hensarling (R, black)
Dallas / Fort Worth
5th Jeb Hensarling (R, black)
Total Population: 30.7W, 19.3B, 43.1H
Voting Age Population: 36.5W, 18.8B, 37.6H
Electorate: 51.9W, 26.7B, 15.4H
Turnout Modeled: 56.8W, 27.3B, 11.2H
Democratic Primary: 34.9W, 46.5B, 13.1H
Republican Primary: 84.3W, 8.9H
Est. Dem. White Share: 34.2%
2008: 55.64 - 44.36 Obama
2012: 55.76 - 44.24 Obama
Average: 49.90 Democratic
PVI: D+3
Dem. Minimum: 47.64
Rating: Lean Democratic
Notes: A very interesting district that I think Lean Democratic might be too pessimistic a rating for, given its rapidly diversifying demographics, Obama's increased performance in 2012, and the seemingly relative inflexibility of the vote shares he got in both years (undoubtedly caused by racial polarization here). Notice the very steep drop-off from the total share to the turnout share among Hispanics: turnout is 1/4 of their total share. Given that African Americans are a significant bloc in the Democratic primary, there is an opening for an African American that can also appeal in style to whites. Taj Clayton, despite his horrible showing against Eddie Bernice Johnson, would be a stellar candidate against Hensarling.
6th Marc Veasey (D, yellow)
Total Population: 34.4W, 27.6B, 29.6H
Voting Age Population: 39.5W, 26.7B, 25.7H
Electorate: 48.8W, 33.0B, 12.0H
Turnout Modeled: 51.4W, 34.7B, 9.3H
Democratic Primary: 26.8W, 57.4B, 10.5H
Republican Primary: 84.5W
Est. Dem. White Share: 30.0%
2008: 58.32 - 41.68 Obama
2012: 56.52 - 43.48 Obama
Average: 52.60 Democratic
PVI: D+5
Dem. Minimum: 52.30
Rating: Safe Democratic
Notes: The primary electorate here moves his current district's evenly split between African American and Hispanic makeup to being heavily African American. Districts like this one don't normally elect African Americans, but given that Veasey is already the incumbent in a setting where the primary electorate is favorably predisposed toward favoring him, I can't see him going down. The Fort Worth portion of his district almost exactly mirrors his old State House district. Arlington comprises the other half of the district, and it happens to be the redder half. Any Republican nominee is likely to come from here.
30th Eddie Bernice Johnson (D, cyan)
Total Population: 34.5W, 39.3B, 23.1H
Voting Age Population: 38.3W, 39.3B, 19.6H
Electorate: 43.8W, 44.9B, 8.9H
Turnout Modeled: 46.8W, 44.8B
Democratic Primary: 22.9W, 68.4B
Republican Primary: 86.3W
Est. Dem. White Share: 30.5%
2008: 63.01 - 36.99 Obama
2012: 61.61 - 38.39 Obama
Average: 59.70 Democratic
PVI: D+9
Dem. Minimum: 57.38
Rating: Safe Democratic
Notes: This lovely creation removes itself from excess Democratic voters so that we can take the 5th and 32nd. In their place it takes in the most Democratic towns in the surrounding area (not that they're Democratic, but more that they're less Republican). Most of the Hispanic population in the district comes from the rural areas, not from Dallas itself. The SSVR rate is so low here that African Americans would never lose their hold on the district.
32nd Pete Sessions (R, red)
Total Population: 41.6W, 14.1B, 34.1H, 8.1A
Voting Age Population: 46.9W, 13.9B, 29.3H, 8.1A
Electorate: 62.2W, 18.4B, 11.7H
Turnout Modeled: 67.2W, 18.6B, 8.4H
Democratic Primary: 50.0W, 32.8B, 10.2H
Republican Primary: 87.2W
Est. Dem. White Share: 40.1%
2008: 54.16 - 45.84 Obama
2012: 53.47 - 46.53 Obama
Average: 46.30 Democratic
PVI: D+1
Dem. Minimum: 40.34
Rating: Lean Republican
Notes: I honestly don't know who Democrats could recruit here with prior governmental experience. Maybe former Dallas Mayor Laura Miller, though I think she'd lose against Sessions in this ancestrally Republican district with a low ceiling for Democrats (as shown by the average and the low Democratic minimum should white revert back to more Republican form here). The Park Cities are removed into the neighboring 3rd to get rid of any area of durable Republican strength. Whoever ran would have to be Anglo, as even the district's Democratic primary electorate is likely to be majority Anglo on the back of growing white Democratic strength in the arts district (yes, this area has liberal whites, surprisingly). Rafael Anchia's state house constituency overlaps with this district, though I couldn't see him as a Hispanic mounting an effective campaign for this seat despite being an incredibly adept politician.
33rd Open (blue)
Total Population: 26.5W, 10.4B, 57.9H
Voting Age Population: 32.2W, 10.8B, 51.6H
Electorate: 48.7W, 16.3B, 29.9H
Turnout Modeled: 53.8W, 18.0B, 24.2H
Democratic Primary: 38.3W, 29.8B, 27.4H
Republican Primary: 74.7W, 19.9H
Est. Dem. White Share: 40.9%
2008: 57.96 - 42.04 Obama
2012: 56.95 - 43.05 Obama
Average: 55.20 Democratic
PVI: D+5
Dem. Minimum: 46.22
Rating: Likely Democratic
Notes: The only reason that I've bumped this down to Likely Democratic is because I would not feel comfortable with a Safe rating given the low Democratic Minimum. This district may exhibit the same tendency of the current 33rd to not elect a Hispanic, despite the very large share of Hispanics overall for three reason: low citizenship rates, low registration rates, and low turnout rates. All three compound into giving the district only 24.2% Hispanic in the turnout model and only 27.4% in the Democratic primary. Both State Rep. Rafael Anchia and former State Rep. (and 2012 Veasey primary to runoff foe) Domingo Garcia would be good recruits here, but State Rep. Lon Burnam would probably bridge the gap between white support and Hispanic support and easily win.
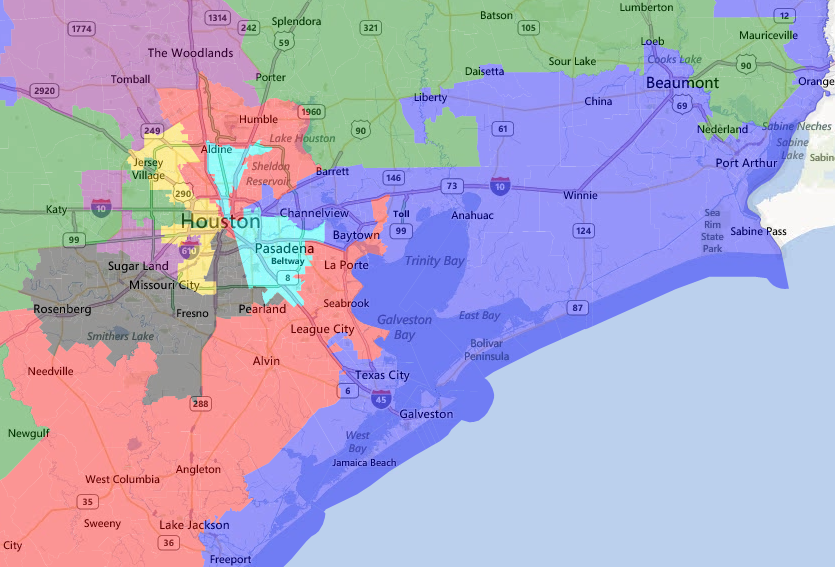 Houston / Beaumont
2nd Open (gold)
Houston / Beaumont
2nd Open (gold)
Total Population: 31.3W, 15.5B, 43.4H, 8.2A
Voting Age Population: 36.1W, 15.3B, 38.4H, 8.8A
Electorate: 51.9W, 22.0B, 17.7H
Turnout Modeled: 57.6W, 22.8B, 13.1H
Democratic Primary: 38.8W, 37.5B, 14.8H
Republican Primary: 83.3W, 10.8H
Est. Dem. White Share: 38.8%
2008: 58.06 - 41.94 Obama
2012: 57.31 - 42.69 Obama
Average: 53.20 Democratic
PVI: D+5
Dem. Minimum: 46.84
Rating: Likely Democratic
Notes: Although Culberson represents most of this district, I think he'd run in the neighboring green district which is safely Republican (he'd have the primary to himself there). I can't imagine Democrats losing this district except in the worse of circumstances. Although Hispanics aren't the dominant share here, I expect that State Representative Jessica Farrar ("I'm the tallest Mexican in the room"... lulz) would be a good recruit and could make it through a primary.
7th Open (purple)
Total Population: 23.9W, 23.1B, 39.3H, 11.7A
Voting Age Population: 27.2W, 22.4B, 35.9H, 12.9A
Electorate: 39.4W, 32.5B, 16.4H, 9.4A
Turnout Modeled: 44.4W, 34.1B, 12.3H
Democratic Primary: 16.4W, 56.8B, 14.0H, 10.4A
Republican Primary: 81.8W, 10.1H
Est. Dem. White Share: 21.1%
2008: 57.55 - 42.45 Obama
2012: 56.75 - 43.25 Obama
Average: 50.60 Democratic
PVI: D+4
Dem. Minimum: 56.66
Rating: Safe Democratic
Notes: Although the average Democratic share is substantially below the minimum, I believe that that is an artifact of previous Republican strength in the area that has dissipated with diversification, higher African American turnout, and weak Democratic candidates running statewide over the past decade. I no longer believe that falling beneath 55% is possible in this area for a Democrat, especially as the area keeps diversifying. The problem, it seems, is what kind of Democrat would emerge from the primary. Our only two elected officials in this area are State Reps. Gene Wu and Hubert Vo. I'm not that big a fan of Vo, given his slumlord reputation. I don't know how he continues to win reelection in a Democratic primary that is substantially black (just as it is in this congressional district), given that his tenants are likely to be poor blacks and Hispanics.
9th Al Green (D, black)
Total Population: 28.9W, 32.2B, 22.1H, 14.8A
Voting Age Population: 31.2W, 32.2B, 19.8H, 15.2A
Electorate: 37.9W, 39.1B, 11.9H, 9.2A
Turnout Modeled: 42.1W, 40.5B, 8.8H
Democratic Primary: 13.4W, 65.1B, 9.7H, 9.8A
Republican Primary: 83.5W
Est. Dem. White Share: 18.9%
2008: 60.24 - 39.76 Obama
2012: 58.00 - 42.00 Obama
Average: 55.50 Democratic
PVI: D+6
Dem. Minimum: 59.59
Rating: Safe Democratic
Notes: This district is pushed out into Fort Bend County, though it maintains its African American base in South Houston. Al Green may very well end up pursuing reelection to the 7th instead as it is also substantially African American and has the other half of his previous constituency. Additionally, much research has shown that African American incumbents are more easily able to gain election in districts that are less than majority African American (though with interplay with the Hispanic CVAP) than are non-incumbents. Doing so would open the 9th for another African American representative and would be more of a sure thing for that other African American. Given that African American (and Hispanic) politicians engage in what is called "strategic group uplift," and that minority politicians know that one of the chief ways in which to engage in that strategic group uplift is to put pressure on party political elites to allow for districts which are capable of supporting descriptive representation to actually do so (see Lublin link above), I would not be surprised for this to happen at all. Note that the white percentage for Democrats here is below 20%, which is more typical of heavily white districts and in line with the rest of Houston's ivy white suburbs. The Democratic Minimum being so high reflects my assumptions discussed above on how far the white vote can legitimately sink, I.E. 20%.
14th Open (blue, Galveston and Beaumont)
Total Population: 40.3W, 25.3B, 30.7H
Voting Age Population: 44.9W, 25.0B, 26.6H
Electorate: 53.4W, 29.7B, 14.2H
Turnout Modeled: 57.6W, 30.0B, 10.2H
Democratic Primary: 28.1W, 56.0B, 13.1H
Republican Primary: 88.1W
Est. Dem. White Share: 24.8%
2008: 52.00 - 48.00 Obama
2012: 49.58 - 50.42 Romney
Average: 55.50 Democratic
PVI: R+2
Dem. Minimum: 48.05
Rating: Tossup
Notes: I'd like to further discuss the literature in this area cited above. Most scholars have found that African American politicians are very much reticent to try to gain election to non-majority minority districts (see the Bernard Grofman compilation above, chapter on "Supply Side" dynamics). Given this, authors have found that these districts themselves never support African American candidates because they simply don't run and when they do, the African American candidates are often too racially confrontational to win over white voters either in the primary or in the general election and thus lose to either a white Democrat, a la Nick Lampson, or a white conservative Republican. As such, although the Democratic primary is dominated by African Americans, do not expect politicians like State Representative Joe Deshotel to run and win for a district like this. Instead, people like State Rep. Craig Eiland, former U.S. Rep. Nick Lampson, etc. are more likely.
18th Sheila Jackson Lee (D, red)
Total Population: 27.7W, 33.7B, 33.8H
Voting Age Population: 31.3W, 33.7B, 30.2H
Electorate: 39.6W, 42.6B, 14.0H
Turnout Modeled: 43.3W, 43.5B, 10.2H
Democratic Primary: 17.5W, 67.9B, 10.9H
Republican Primary: 83.4W, 9.1H
Est. Dem. White Share: 24.5%
2008: 61.22 - 38.78 Obama
2012: 60.48 - 39.52 Obama
Average: 56.60 Democratic
PVI: D+8
Dem. Minimum: 58.88
Rating: Safe Democratic
Notes: Sheila Jackson Lee is known as one of the most horrible Congresspeople to work with. Unfortunately, I doubt that a primary challenge would ever go anywhere. This district is as safe for Jackson Lee as ever and her whacko tributes to Michael Jackson.
29th Gene Green (D, cyan)
Total Population: 14.8W, 8.2B, 74.0H
Voting Age Population: 18.2W, 8.9B, 69.6H
Electorate: 31.1W, 15.2B, 50.3H
Turnout Modeled: 38.3W, 17.5B, 41.3H
Democratic Primary: 21.0W, 28.7B, 46.4H
Republican Primary: 62.1W, 34.2H
Est. Dem. White Share: 31.6%
2008: 58.19 - 41.81 Obama
2012: 57.43 - 42.57 Obama
Average: 60.50 Democratic
PVI: D+5
Dem. Minimum: 53.36
Rating: Safe Democratic
Notes: The current district isn't much more Hispanic than this one, and the turnout demographics are almost certainly very similar to what I've modeled above. One of the reason why Gene Green won the original primary is because of his courtship of African American votes (see above cited literature, which covers this very race). I doubt that a Hispanic candidate can themselves win election here just yet. As such, I doubt that unless Battleground Texas makes very large headway registering eligible Hispanic that a second Hispanic district will be warranted in the 2020 round of redistricting because this district simply cannot afford to lose its northern half to anchor a second Hispanic district.
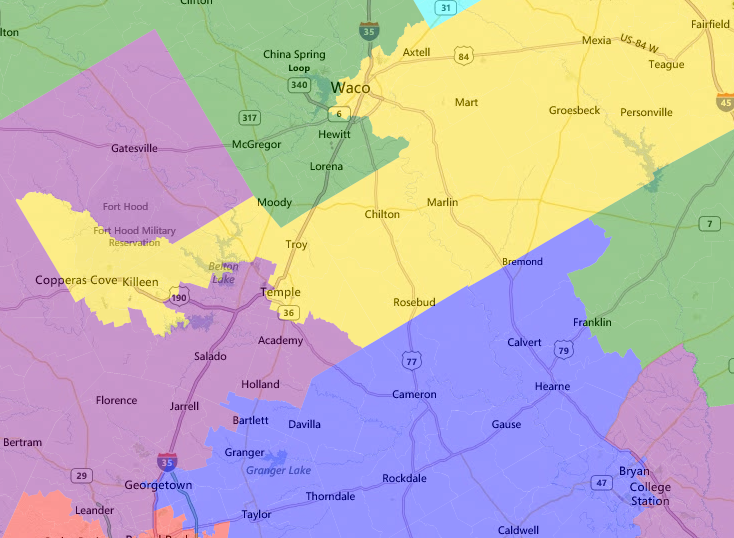
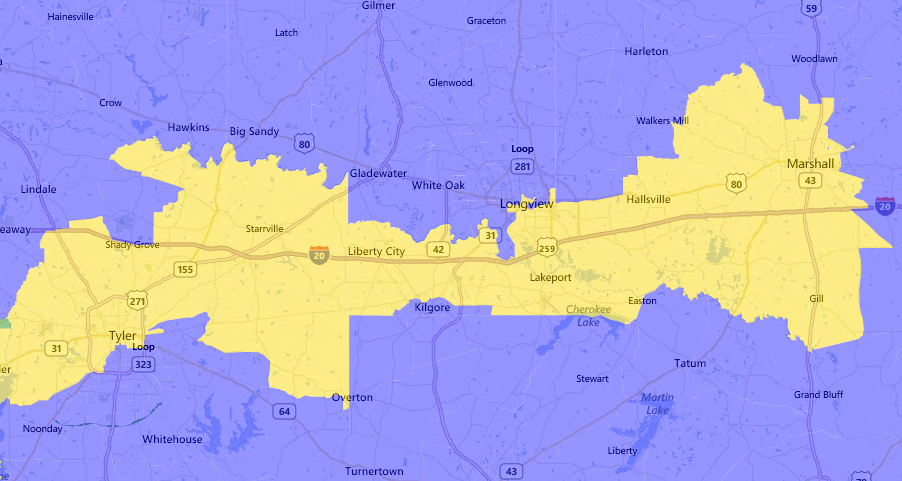
17th Open (yellow, Waco, Tyler, and Killeen)
Total Population: 46.6W, 24.5B, 24.3H
Voting Age Population: 51.4W, 24.1B, 20.5H
Electorate: 58.8W, 27.6B, 10.2H
Turnout Modeled: 62.6W, 27.4B
Democratic Primary: 29.2W, 56.1B, 10.9H
Republican Primary: 91.6W
Est. Dem. White Share: 21.6%
2008: 48.24 - 51.76 McCain
2012: 44.56 - 55.44 Romney
Average: 48.00 Democratic
PVI: R+6
Dem. Minimum: 45.40
Rating: Likely Republican
Notes: The last district which Democrats could possibly win would require a bit more of democratic drift before it is put more firmly into reach. Notice that although the district is majority minority in all population, that after you account for VAP, registration trends, and model the turnout, Hispanics disappear from being a vital voting bloc, and whites exceed 60%. That is only marginally more minority than the state as a whole (though with African Americans making double their share and Hispanics making less than half). There's always the possibility that a Chet Edwards-esque figure comes out of nowhere to reassemble the Waco coalition between the white working class and minorities that previously existed.
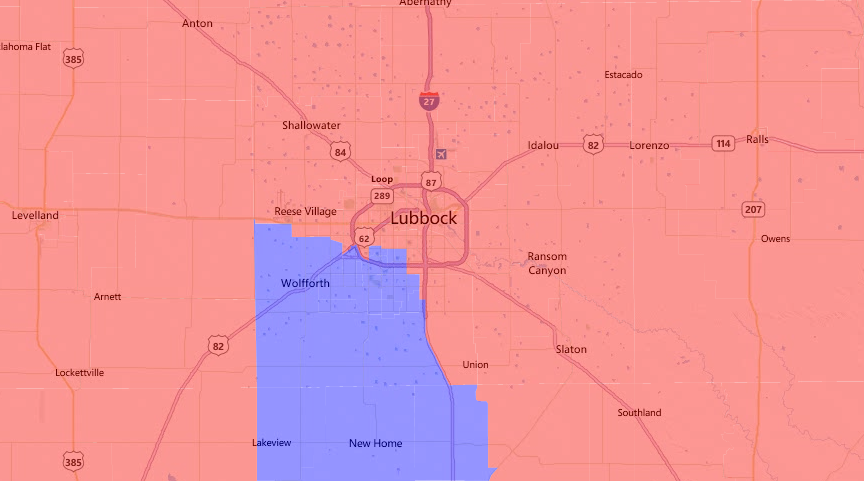
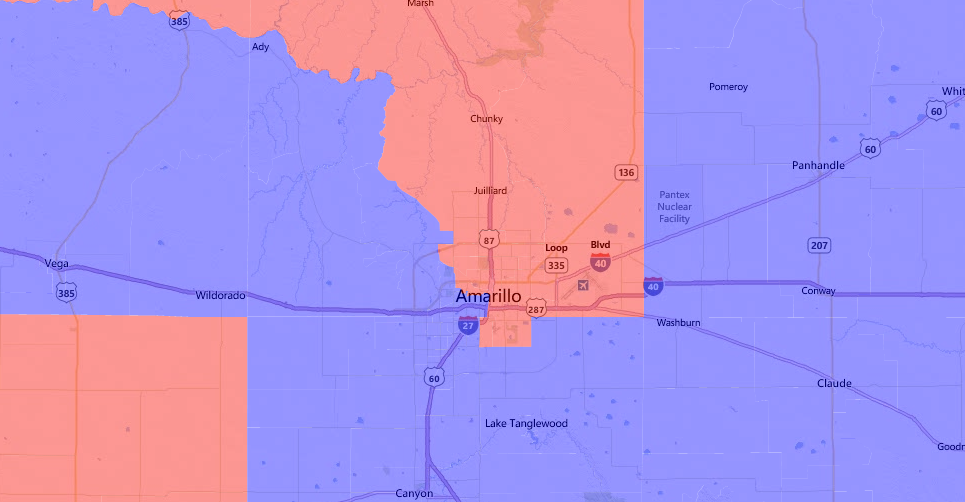
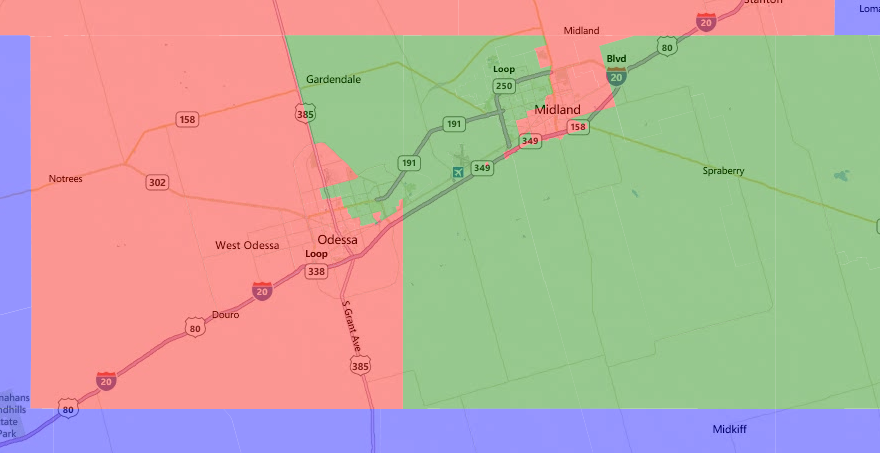
19th Randy Neugebauer (R, red, Lubbock)
Total Population: 41.7W, 48.9H
Voting Age Population: 47.1W, 43.5H
Electorate: 55.3W, 34.5H
Turnout Modeled: 65.0W, 8.6B, 24.3H
Democratic Primary: 14.3W, 27.8B, 53.5H
Republican Primary: 86.3W, 12.1H
Est. Dem. White Share: 6.5%
2008: 31.22 - 68.78 McCain
2012: 27.88 - 72.12 Romney
Average: 33.10 Democratic
PVI: R+23
Dem. Minimum: 31.83
Rating: Safe Republican
Notes: This really is a fantasy and I don't know why I'm even bothering including it in the write-up, but if Democrats ever got their act together in Texas this is the kind of district that might actually become competitive. SSVR here is 34.5%, which is pretty significant, but because of the low registration rates (the SSVR could actually be higher, as Midland and Odessa actually have some of the higher citizenship rates in the state), low turnout rates, and comparative conservatism of Hispanics in the panhandle, Democrats aren't currently able to compete. A pronounced effort might actually make the difference between a 70-30 loss and a 60-40 loss and further trend towards Democrats. But here's the bigger issue: if Democrats want to start winning statewide, they need a functioning apparatus in areas like this. They need to compete with themselves to turn themselves out and make voting a habit.
One last note: this district may very well run afoul of Supreme Court jurisprudence, though, with respect to race being a central factor in the drawing of the district (e.g. Shaw v. Reno and then Miller v. Johnson). I'd argue that because this district is more cleanly drawn than either of the districts in the cases before the court then, and that Hispanics are not able to elect their candidate of choice here, that such a district does not count as being racially gerrymandered. Although, one could very easily argue that the only justification for the lines is race itself since partisanship doesn't much play a factor in the lines.
Recap
Safe Democratic: 9
Likely Democratic: 6
Lean Democratic: 2
Tossup: 3
Lean Republican: 1
Likely Republican: 1
Safe Republican: 14
All districts that are Likely Democratic are only on the outside edge of being so (e.g. the 20th) and are quickly trending away from Republicans into Safe Democratic territory. They'd have to strike while the iron is hot. Overall, I'd guess that Democrats would have won 20 of the districts in 2012, the only two that I do not think would have gone our way are the 32nd (too red down ballot with an incumbent Republican) and the 17th (slightly too red generally).
On white support for Democrats: keep in mind that in all of these districts, the white share (and not just that... the total number of white votes) is very very low and a low share of the overall white population in the state. The districts that are safely Republican are all very white and have much higher turnout, such that the overall white support for Democrats is still likely to be in the 20-25% range.
Hispanic Ability: 7 (15, 16, 20, 27, 28, 29, 34)
Hispanic Opportunity: 2 (23, 33)
African American Ability: 3 (9, 18, 30)
African American Opportunity: 2 (6, 7)
Coalition: 1 (25)
Additionally, minorities may have some openings in a few other districts but that isn't by any means a guarantee. See, for instance, the 5th and the 2nd. Maybe even the 14th and the 17th if Democrats are feeling very ambitious and adventurous, but previous literature in this area suggests that won't happen because of the supply side dynamic involved.
More Pics:
 If you have any questions, critiques, or comments, feel free to ask me in the comments (ofcourse). Feel free to be especially pushy on the methods and the assumptions in my data. The best data is arrived at through push and pull, give and take, between writer and reader, teacher and student, and between peer and peer. We all want the best product, so let's get that best product.
