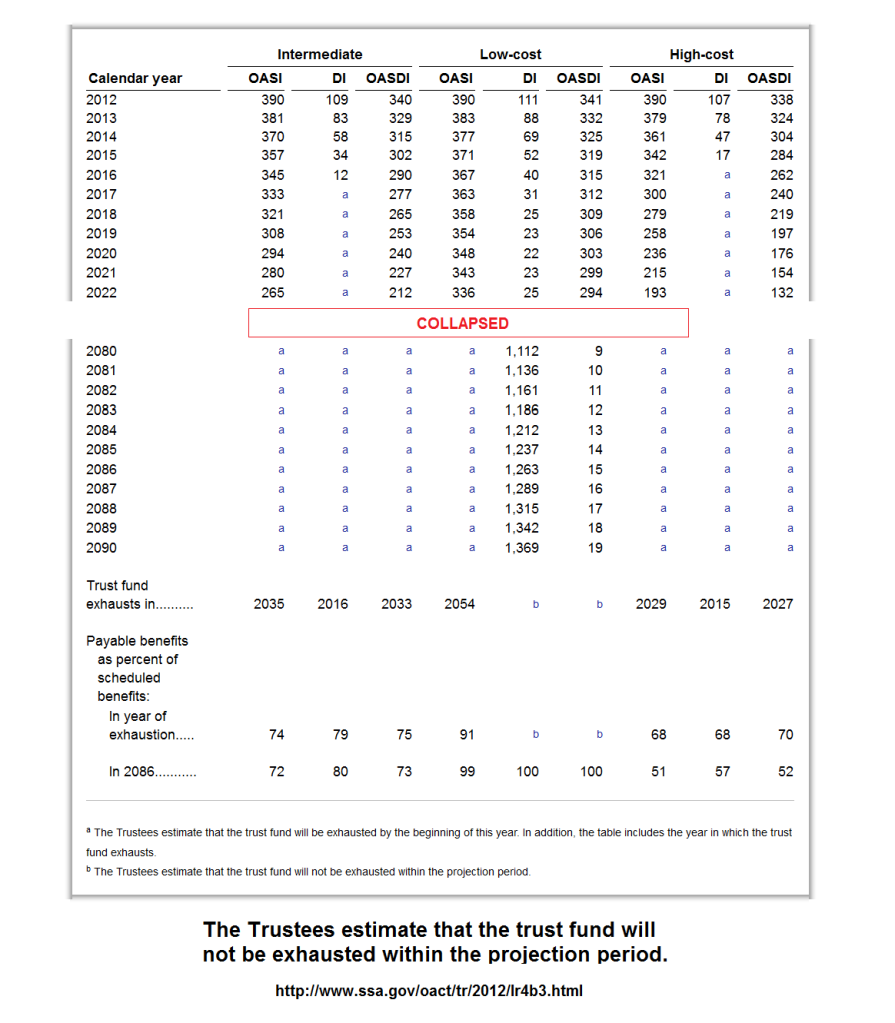
When a new Social Security report comes out, the first thing I like to look at is the Trust Fund Ratios. The 2013 report showed a decline in funds looking thru 2090 compared to 2012. In 2012, the low cost scenario showed that the OASDI Trust Fund would not be exhausted thru 2090.
Each annual SS report uses 3 cost scenarios, Low Cost, Intermediate Cost and High Cost, and a 4th scenario, the Stochastic Model. Low Cost, Intermediate Cost and High Cost scenarios use different values for things like GDP, workforce growth rates, interest rates, etc. the Actuaries generate the different scenarios. In general terms job creation can be the largest driver of increasing or decreasing Trust Fund revenues, wage growth is second and interest rates can be 3rd for our purposes.
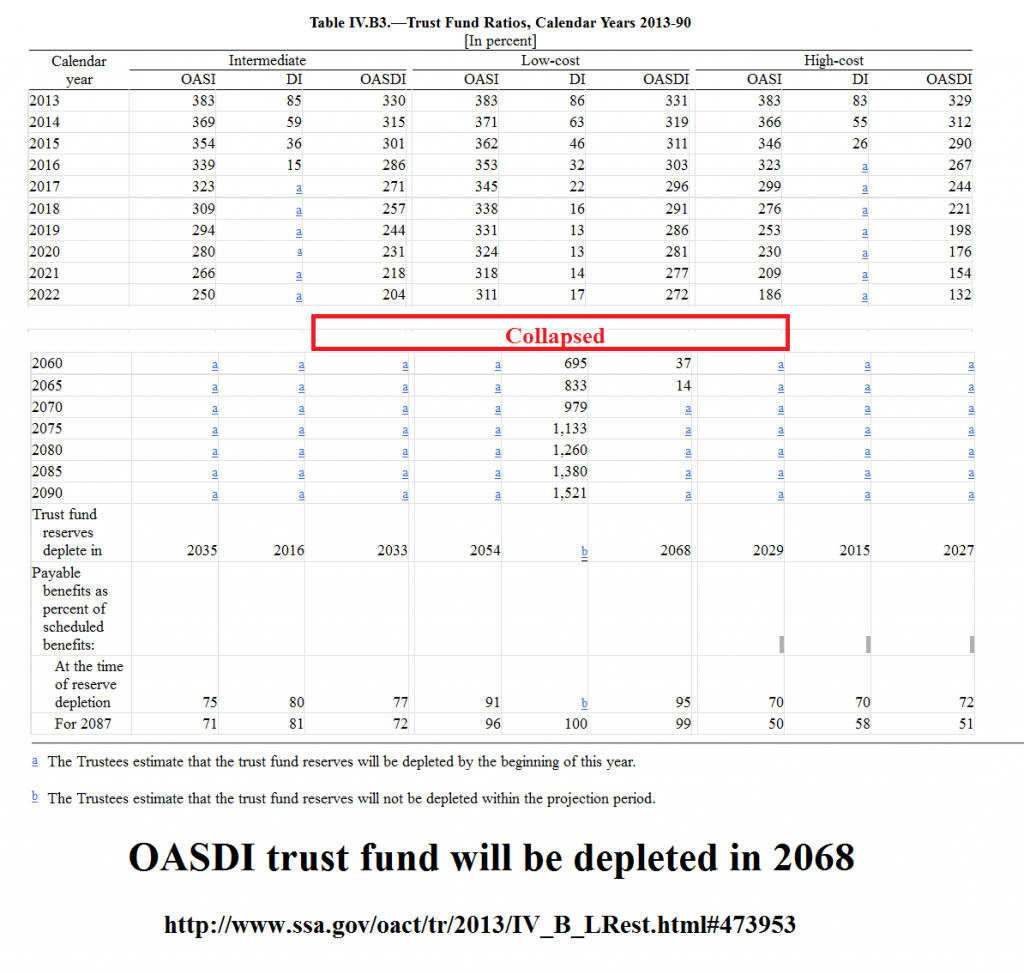
In 2013, the OASDI Trust Fund was predicted to be exhausted in 2068 in the Low Cost scenario. In the 2014 report the the OASDI Trust Fund was predicted to not be exhausted thru 2090 in the Low Cost scenario.

 This is good news, because it indicates that large scale job creation and wage growth can fix any problem with OASDI. In the 2013 report that would not have been enough. Heres my favorite SS thought experiment: serious infrastructure spending, like in the New Deal, about 5% of GDP would create 20 million jobs. In the US we've got probably around 25 million people looking for year round, full time work, creating 20 million jobs would drive U3 unemployment to below 5%, and the long term U6 unemployment to 6% or less. 20 million jobs at 36k each would add 89.2 billion in additional FICA revenue each year. Thats about .6% of GDP, and the predicted SS shortfall was estimated by the CBO in 2010 as .6% of GDP. Today .8% is probably a more realistic number.
Over the last 6 years median household income dropped from 50k to 45k, thats a $5,000 pay decrease in this households. Lets reverse that: Wage growth of $5,000 for 50 million people would add about 31 billion in additional FICA, about .2% of GDP.
Trust Fund Ratios from the 2012 SS report:
Trust Fund Ratios from the 2013 report:
Trust Fund Ratios from the 2014 report:
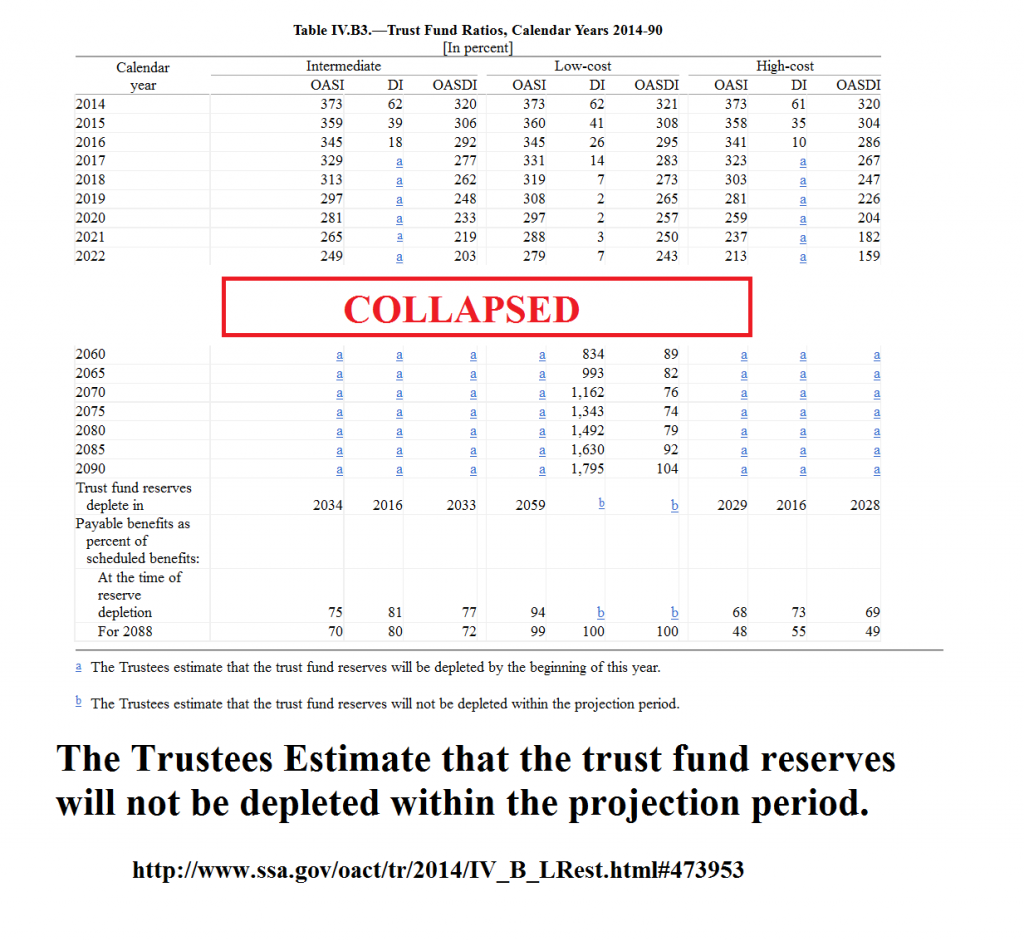
On each chart look at the low cost, OASDI column. The Social Security Trust Fund is in better shape in 2014 than it was in 2012. The question is will the economy improve in the manner of the low cost scenario or the intermediate scenario? The low cost scenario assumes 2.6% to 2.8% GDP growth after 2020. The Intermediate cost scenario assumes GDP growth of 2% to 2.2%. 2% growth for the next 20 years isn't very realistic, that assumes recession like conditions for 20 years, something that hasn't happened for since modern economic metrics started being measured in the 1800's when industrial production was measured, then around 1930 the switch was made to GNP, and about 25 years ago GNP was switched to GDP.
So thats an initial take on the 2014 SSTF report, please remind your representatives in DC to pass some serious job bills, raise the minimum wage & expand SS benefits for seniors.
Please consider checking out Bruce Webbs blog, Angry Bear.
Social Security: the Shape of Solvency
Heres the link to the 2014 SSTF report:
http://www.ssa.gov/...
