On Tuesday, March 11, voters in Northern New Hampshire went to the polls to choose who would represent them on the New Hampshire Executive Council. The First District was left open by the death, last November, of former Councillor Raymond Burton, a highly popular, genuinely moderate Republican who had served on the Executive Council since 1981. This district includes the northern two-thirds of the state, and contains about 260,000 people. The district leans Democratic, as Obama won it with 57 percent of the vote in 2008 and 55 percent in 2012, however Burton had never faced a serious challenge. Thus, it was pretty much assumed that the election to replace Burton would be quite close, and indeed it was. The two candidates were Republican Joseph Kenney of Wakefield, a former state Senator and gubernatorial candidate, and Democrat Mike Cryans of Hanover, a Grafton County Commissioner. Both candidates campaigned as nonpartisan problem solvers, a campaign style that is very popular in state and local races in New England. In this race, national issues were less important than state and local issues and the candidates themselves.
Ultimately, Kenney won by about three percent, 51.5-48.5. Follow me below the fold for an analysis of the results, town-by-town.
Color code for the maps below:
Darkest blue: 80%+ for Democrats
Dark blue: 70-79.99% for Democrats
Normal blue: 60-69.99% for Democrats
Lighter blue: 55-59.99% for Democrats
Lightest blue: 50-54.99% for Democrats
Yellow: Tie
Pink: 50-54.99% for Republicans
Normal red: 55-59.99% for Republicans
Brown: 60-69.99% for Republicans
Dark red: 70-79.99% for Republicans
Darkest red: 80%+ for Republicans
White: No votes cast, or outside of district
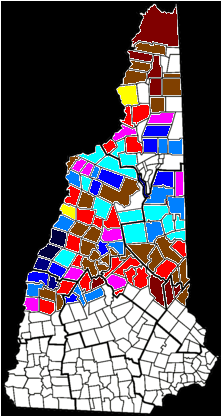
First of all, here is a map of the results Tuesday (to see bigger pictures, click through):
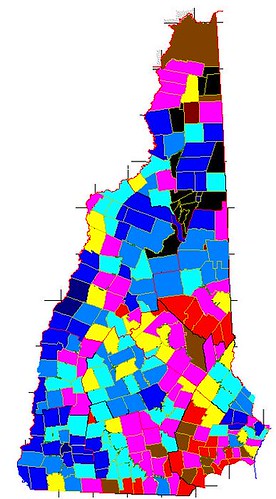
Here, for comparison, is a town-by-town map of Obama’s 2012 performance in New Hampshire:
As the first map clearly shows, Cryans performed the best in his hometown of Hanover and the nearby towns. This is the most Democratic part of the district, and Cryans outperformed the Democratic baseline in many of the towns here, getting 90 percent in Hanover and 73 percent in Lebanon. However, the further we get away from Lebanon and Hanover, the more Cryans’ performance drops. The only other areas of the district where Cryans performed well were New London (home to Colby-Sawyer College), Plymouth (home to Plymouth State), northern Carroll County (which is a touristy area), and the Berlin area. Kenney performed the best in the southeastern part of the district (which is his old State Senate district), the central part of the district (basically the towns near Plymouth), and sparsely-populated northern Coos County. He also did quite well in the Laconia area and the towns surrounding Lake Winnipesaukee.
Here is a map that compares Cryans’ performance in each town to Obama’s performance in the 2012 election.
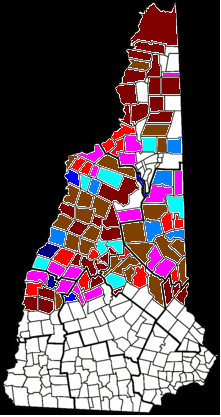
As the map shows, Cryans overperformed substantially in Hanover, also overperformed in a few other towns, and underperformed almost everywhere else. These underperformances were particularly severe in the Claremont-Newport area in Sullivan County, in rural Grafton County (strange, since Cryans is a Grafton County Commissioner), and the regions that I pointed out earlier: the towns south of Plymouth, the southeastern part of the district, and northern Coos. The differences that we see in swings in otherwise very similar towns are probably the result of the relative amount of effort the campaigns put into each town.
And here’s the final map: a comparison of turnout in the Executive Council election in 2012 to that of this one. Blue represents higher relative turnout, red represents lower relative turnout. The range here was 14 percent to 70 percent.
Color code for this map:
Dark blue: 60+% of 2012 turnout
Normal blue: 50-59.99% of 2012 turnout
Lighter blue: 40-49.99% of 2012 turnout
Lightest blue: 35-39.99% of 2012 turnout
Pink: 30-34.99% of 2012 turnout
Normal red: 25-29.99% of 2012 turnout
Brown: 20-24.99% of 2012 turnout
Dark red: <20% of 2012 turnout
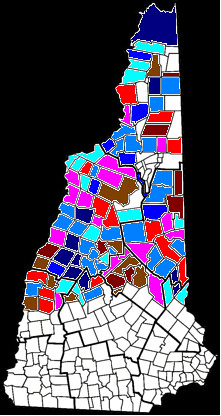
As the map shows, most of Cryans’ strongest towns had very low turnout. Turnout in Hanover was only about 1/6 of what it was in 2012, and the news wasn’t much better in Lebanon, Plymouth, Berlin, and Conway. While turnout in the Laconia area was also very low, many of Kenney’s best towns, and the towns where he outperformed Romney the most, had some of the highest turnout. The towns south of Plymouth, where Kenney did significantly better than Romney, all had above-average turnout, and some of the towns in Kenney’s old State Senate district had turnout more than 50 percent of 2012. Thus, I think it’s clear that turnout among college students was very low, and that may have cost Cryans the election, considering that he lost by only 1,267 votes.
This seat will be up for election again this November, and based on the election results it seems to me that this race slots firmly into the Tossup category. With increased turnout among college students as a result of it being a regularly-scheduled election, whichever Democrat runs will have a more solid base of support. However, Kenney will have been the incumbent for almost eight months, and he might be able to entrench himself. At the very least, Democrats will be able to expand the playing field so that they are not just defending their two vulnerable incumbents on the Executive Council.

