The Pennsylvania State Senate is one of the most gerrymandered state legislatures in the country. Republicans currently control it 27-23, however that includes several Democrats precariously perched in some strongly Republican districts in Western Pennsylvania while Republicans hold a few light-blue seats in Eastern Pennsylvania. The next opportunity to redraw the state senate districts will be in 2021, and if Democrats have the opportunity to draw themselves a favorable map, I decided to find out what sort of map they could draw.
There are several rules to be followed in Pennsylvania redistricting. Districts must have a deviation of less than 5 percent from the ideal population (thus, the maximum deviation is about 12,700 people). Municipalities and city wards are to be split only when absolutely necessary. The actual map splits more municipalities and wards than necessary, while my map splits only three municipalities (excluding Philly and Pittsburgh) and does not split any wards of those two cities.
This map would guarantee a Democratic majority in the State Senate in almost any year, and even in a year like 2010 Dems would still be favored to keep the majority. Let’s go beyond the fold to look at the map!
This diary is posted to Daily Kos Elections, an official Daily Kos subsite. Please read the DKE Mission Statement. Our focus is on electoral politics rather than policy or preference. Welcome aboard!
This diary does NOT invite comment on the ethics of gerrymandering, or on any policy issue.
Here is a map of the entire state:
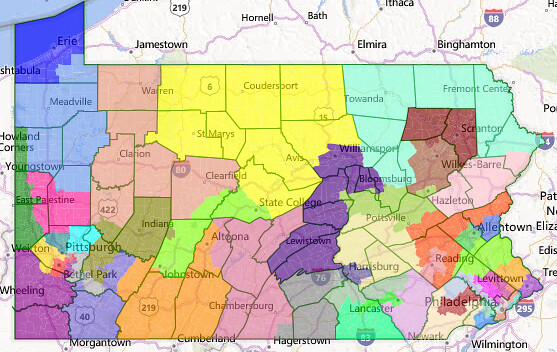
District 1 (blue): Sean Wiley (D-Millcreek Township)
Demographics: 88/7/3/1 (white/black/Hispanic/Asian, all VAP)
Prez ’12: Obama 59-40
Average: 56-44 Democratic
This district is located entirely in Erie County. Although this district had been represented by a Republican for a while before 2012, Wiley won the open seat that year in a landslide. He’s quite safe. SAFE D.
District 2 (green): Bob Robbins (R-Greenville)
Demographics: 91/7/1/1
Prez ’12: Obama 51-47
Average: 58-42 Democratic
This district stretches along the Ohio border in Mercer, Lawrence, and Beaver counties. These areas are trending Republican, but many of the Republican areas in these counties are in the 10th and 12th districts. Democrats hold several Romney-voting state representative districts in this area. Robbins is retiring this year, and Elder Vogel, who represents much of this area, lives outside of the district in New Sewickley Township. A Democrat would definitely be favored here. LIKELY D.
Here is a map of the Pittsburgh area:
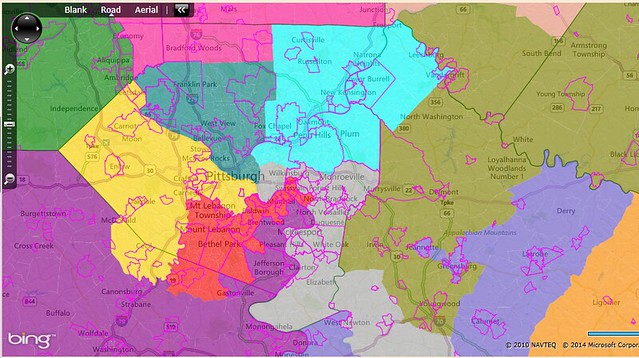
District 3 (purple): Tim Solobay (D-Canonsburg)
Demographics: 92/6/1/1
Prez ’12: Romney 52-47
Average: 57-43 Democratic
This district includes all of Greene County, all of Washington except Peters, Cecil, and McDonald, and the towns of Jefferson Hills, Clairton, West Mifflin, and Duquesne in Allegheny County. Solobay, a former state representative, won this open seat in 2010 during the Republican wave, and is popular in the district. While this area is trending Republican (as shown by Romney’s being the first Republican presidential candidate to win here in several decades), Democrats still dominate in downballot races. Depending on how fast the Republican trend trickles down the ballot, Solobay might be vulnerable later in the decade, but he’s pretty secure now. LIKELY D.
District 4 (red): Matt Smith (D-Mount Lebanon)
Demographics: 90/6/1/3
Prez ’12: Obama 50-48
Average: 54-46 Democratic
This district takes in a few strongly conservative suburbs of Pittsburgh such as Peters and Upper St. Clair, and then goes north to include Mount Lebanon, Baldwin, Munhall, and Swissvale. While the presidential results in this district were very close, Smith won a 43-percent-Obama open seat in 2012, doing very well in his hometown of Mount Lebanon (the largest municipality in the district) and outperforming Obama by 10 points in Peters. With the district moving seven points to the left, Smith should be fine. LIKELY D.
District 5 (gold): Wayne Fontana (D-Pittsburgh)
Demographics: 88/8/1/2
Prez ’12: Obama 54-44
Average: 59-41 Democratic
This district takes in Cecil and McDonald in Washington County, then all of southwest Allegheny County, and all of Pittsburgh south of the Ohio River. Obama’s performance here is pretty much the low point for Democrats, and an established incumbent such as Fontana should be able to do much better. SAFE D.
District 6 (teal): Randy Vulakovich (R-Shaler Township)
Demographics: 82/12/1/3
Prez ’12: Obama 54-44
Average: 57-43 Democratic
This district takes in the northern and central areas of Pittsburgh, including the Point, and then goes north and west to take in some right-leaning, but not ultraconservative, suburbs. There are plenty of Democratic state representatives here who would be happy to take on Vulakovich, and in a district like this, I don’t see how a Republican could win. Vulakovich might even try to carpetbag up to the open 10th, since there’s no way he could win here. SAFE D.
District 7 (dark gray): Jay Costa (D-Forest Hills), Jim Brewster (D-McKeesport)
Demographics: 81/12/2/4
Prez ’12: Obama 61-38
Average: 65-35 Democratic
This district contains the southeastern areas of Pittsburgh, and then goes east and south to take in Monroeville, North Versailles, McKeesport, Elizabeth, and East Huntingdon. While both Costa and Brewster live here, Costa would most likely move a few miles north into the 9th and run there, since Jim Ferlo is retiring. Brewster or any Dem would win this district easily. SAFE D.
District 8 (slate blue): Rich Kasunic (D-Dunbar Township)
Demographics: 95/4/1/0
Prez ’12: Romney 55-43
Average: 55-45 Democratic
This district contains all of Fayette County and a Blue Doggish portion of Westmoreland County, including Jeannette, Greensburg, and Latrobe. Hempfield Township is split here, one of the three split municipalities in the state. While Democratic performance at the presidential level has absolutely tanked here, Democrats can and do still win here at the state legislative level. Kasunic is retiring this year, and St. Rep. Deb Kula, the Democratic candidate, would be able to win here without too much trouble. The Democrats’ time holding this district is running out, but as of now I’d say this is LEAN D with a strong Democratic candidate, TOSSUP without one.
District 9 (cyan): Jim Ferlo (D-Pittsburgh)
Demographics: 79/17/1/2
Prez ’12: Obama 59-39
Average: 62-38 Democratic
This district takes in the northeast portions of Pittsburgh and its northeastern suburbs such as Penn Hills and Plum, and extends north to Harrison Township and east to Vandergrift. This district has significant overlap with Ferlo’s current district, but he is retiring, so Jay Costa would probably run here, since he lives only a few miles away. He’d be completely safe here. SAFE D.
District 10 (deep pink): Elder Vogel (R-New Sewickley Township)
Demographics: 97/1/11
Prez ’12: Romney 66-33
Average: 61-39 Republican
This district takes in the northernmost townships of Allegheny County, the eastern areas of Lawrence and Beaver Counties, and the most populated parts of Butler County. It is the first Republican vote sink on the map, but not the last. While Vogel lives here, the center of population of this district is Butler County, so he might face a primary challenge. Randy Vulakovich might carpetbag here, and another possible candidate is homophobic, right-wing, Tea Party nutcase St. Rep. Daryl Metcalfe of Butler. Any Republican is completely safe here. SAFE R.
District 11 (lime green): John Wozniak (D-Johnstown)
Demographics: 89/4/3/4
Prez ’12: Romney 51-47
Average: 57-43 Democratic
This district includes most of Cambria County, a small portion of Clearfield County, and the State College area in Centre County. Wozniak narrowly won re-election in a redder district in 2012 as that district voted less than 40 percent for Obama. I made Wozniak more secure by dropping most of Clearfield and all of Clinton and adding the State College area. This whole area swung strongly toward Romney in 2012; this district actually voted 55-43 for Obama in 2008. But considering Wozniak’s ability to win a much redder district, he’ll probably do fine here, and there are several Democratic state representatives here who could run if he retired. LIKELY D.
District 12 (cornflower blue): Scott Hutchinson (R-Oil City)
Demographics: 97/1/1/1
Prez ’12: Romney 60-37
Average: 59-41 Republican
This district is quite compact and takes in all of Crawford and Venango Counties as well as the remainders of Erie, Mercer, and Butler. Democratic areas here are few and far between. Hutchinson would win here easily. SAFE R.
District 13 (dark salmon): Joe Scarnati (R-Brockway)
Demographics: 97/1/1/0
Prez ’12: Romney 66-32
Average: 59-41 Republican
This district contains a bunch of rural counties that swung heavily Republican in 2012. Its center is Scarnati’s home of Jefferson County, and it also contains the remainder of Clearfield, all of Warren, Forest, and Clarion, and part of Armstrong. Scarnati would win this in a landslide. SAFE R.
District 14 (olive): Kim Ward (R-Hempfield Township), Don White (R-Indiana)
Demographics: 96/2/1/1
Prez ’12: Romney 63-35
Average: 56-44 Republican
This district takes southern Armstrong County, western and central Westmoreland, and all of Indiana County. If both Ward and White decided to run here, this would be an epic primary, as Ward would do well in Westmoreland while White would clean up in Indiana. Either would be a shoo-in in the general election. SAFE R.
District 15 (tomato): John Eichelberger (R-Duncansville)
Demographics: 96/2/1/0
Prez ’12: Romney 69-29
Average: 62-38 Republican
This district includes eastern Westmoreland, almost all of Somerset, all of Bedford, and part of Blair. This is the second-reddest district on the map (after the neighboring 25th), and it’s trending even more Republican. Eichelberger wouldn’t need to do much to get re-elected here. SAFE R.
Here is a map of SEPA:
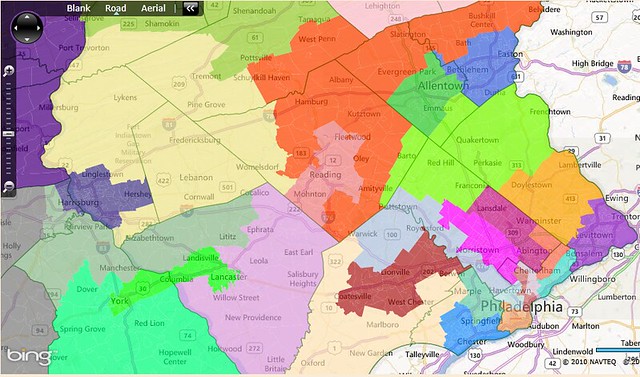
District 16 (lime green): Scott Wagner (R-Spring Garden Township)
Demographics: 72/9/15/2
Prez ’12: Obama 57-41
Average: 52-48 Democratic
The only way to get a Democratic district out of Lancaster and York Counties is to include both major cities in the same district, and this district does just that. It includes three townships and four boroughs in York County along with the city of York, and three whole townships, parts of two more, and four boroughs in Lancaster County along with the city of Lancaster. Manheim and Manor townships in Lancaster County are both split here, due to their divides between the purple inner suburban areas and the deep-red outer areas. Wagner would probably run in the 27th, leaving this district for either St. Reps Mike Sturla of Lancaster or Kevin Schreiber of York. While Democratic performance can decline precipitously here in off-years, both Sturla and Schreiber would be strong candidates. LIKELY D.
District 17 (dark slate blue): Rob Teplitz (D-Susquehanna Township)
Demographics: 72/17/6/4
Prez ’12: Obama 55-43
Average: 51-49 Democratic
This district is centered on Harrisburg and takes in all the city’s inner suburbs, and also goes east to pick up Derry Township, home of Hershey. Teplitz picked up an open seat here in 2012 that was a few points redder, so he should be fine here as long as the elections happen in presidential years (black turnout in Harrisburg plunges in midterm elections). LIKELY D.
District 18 (yellow): Jake Corman (R-Benner Township)
Demographics: 96/2/1/0
Prez ’12: Romney 63-35
Average: 59-41 Republican
This district, the largest in the state, includes McKean, Potter, Elk, Cameron, Clinton, and Tioga Counties, as well as the remainder of Centre and rural northern Lycoming. This is hard-core rural Republican territory, and Democrats stand no chance of even being close here. SAFE R.
District 19 (yellow-green): Dave Argall (R-Rush Township)
Demographics: 90/3/6/1
Prez ’12: Romney 51-46
Average: 50-50 Democratic
This is an all-new swing district that takes in all of the Democratic-leaning towns in the area, including Lewisburg, Selinsgrove, Sunbury, Shamokin, Danville, Mount Carmel, Bloomsburg, Pottsville, Shenandoah, and Hazleton. This is basically a land of anthracite coal mining and small colleges. Interestingly, areas in which anthracite is mined voted more Democratic in 2012 than areas where bituminous coal is mined, and these anthracite areas actually swung slightly toward Obama in 2012. The district voted for Obama by 50 votes in 2008, and for Romney by about 4.5 points in 2012. A Tim Holden-esque Democrat (such as St. Rep Neal Goodman) could definitely be competitive here. Argall would probably be slightly favored due to incumbency, but Democrats would strongly contest this. LEAN R.
District 20 (pink): Lisa Baker (R-Lehman Township)
Demographics: 80/8/9/2
Prez ’12: Obama 53-46
Average: 52-48 Democratic
This district includes all of Carbon and Monroe Counties, and three townships of Pike. A slightly less compact version of this district was created as a new district for the actual map, and the likely winner there, Republican Mario Scavello, lives in Monroe County. Democrats can usually win Monroe County in presidential election years but not in midterms, so Dems might have a good chance here. The Dems’ bench here was destroyed in 2010, but as more people move from the NYC area to Monroe County, this area should trend Democratic. Due to the swingy nature of this district, I’ll call it a TOSSUP.
District 21 (maroon): John Blake (D-Archbald)
Demographics: 93/2/3/2
Prez ’12: Obama 60-39
Average: 57-42 Democratic
This district includes Lackawanna and Wyoming Counties, and a small portion of Luzerne. With the strong Democratic base of Scranton and the nearby small towns, Blake has nothing to worry about. SAFE D.
District 22 (sienna): John Yudichak (D-Plymouth Township)
Demographics: 93/3/3/1
Prez ’12: Obama 54-45
Average: 57-43 Democratic
This district is entirely contained in Luzerne County, and takes in all of it except the Hazleton area, the Dallas area, and the conservative western part of the county. These people are generally straight-ticket Democrats, and Yudichak is safe. SAFE D.
District 23 (aquamarine): John Gordner (R-Berwick)
Demographics: 95/1/2/1
Prez ’12: Romney 60-38
Average: 60-39 Republican
This strongly Republican district looks similar to Lisa Baker’s actual district, however it loses Baker’s hometown and gains Gordner’s hometown. Both are based in Wayne, Susquehanna, and Bradford Counties. Democrats have no bench and no chance here. SAFE R.
District 24 (indigo): Eugene Yaw (R-Loyalsock Township)
Demographics: 94/3/2/1
Prez ’12: Romney 67-31
Average: 66-34 Republican
This district is a true ‘T’ district, and contains Williamsport, Milton, and a bunch of strongly conservative rural areas in the central part of the state. It contains portions of counties from Columbia to Lycoming to Union to Perry. No Democrat should contemplate even getting close here; these Republicans have no Blue-Dog tendencies and vote straight ticket. SAFE R.
District 25 (pale violet red): Rich Alloway (R-Hamilton Township)
Demographics: 94/3/2/1
Prez ’12: Romney 70-28
Average: 68-32 Republican
This district, in the south-central part of the state, is the most Republican district in the state. It includes all of Mifflin, Huntingdon, and Fulton Counties, and parts of Blair and Franklin. These are consistently some of the reddest counties in the state. This area is where the epithet “Pennsyltucky” refers to. SAFE R.
District 26 (gray): Pat Vance (R-Silver Spring Township)
Demographics: 93/2/3/1
Prez ’12: Romney 61-37
Average: 62-38 Republican
This district contains all of Adams County, the remainder of Franklin, and most of Cumberland County. The only blue dots here are the college towns of Gettysburg, Shippensburg, and Carlisle, and they are vastly outvoted by the strongly-Republican rural areas. Vance would be completely safe here. SAFE R.
District 27 (spring green): Open Seat
Demographics: 94/2/2/1
Prez ’12: Romney 63-35
Average: 64-36 Republican
This district is entirely contained in York County and includes much of the conservative countryside there. It also includes some of the conservative suburbs of York, such as York Township, Manchester, West Manchester, and Dover. Scott Wagner lives just over the line in the 16th, but he would run and win here. SAFE R.
District 28 (plum): Lloyd Smucker (R-West Lampeter Township)
Demographics: 94/1/3/2
Prez ’12: Romney 66-32
Average: 70-30 Republican
This district is entirely contained in Lancaster County and includes the southern and eastern areas of that county. Much of Pennsylvania’s Amish County is located here. Downballot, these are some of the most Republican areas in the whole state, as this district’s average is the most Republican in the state. Smucker previously had to deal with the city of Lancaster in his district. He wouldn’t have to deal with that anymore here. SAFE R.
District 29 (dark sea green): Mike Brubaker (R-Warwick Township)
Demographics: 93/2/2/2
Prez ’12: Romney 64-34
Average: 67-33 Republican
This district contains northern and northwestern Lancaster County, northern York County, and the remainder of Cumberland County. It’s basically just a leftovers district that happens to neatly take in just the right number of people from those three counties to not need any more people from other counties. Brubaker would coast to re-election. SAFE R.
District 30 (light coral): Judy Schwank (D-Fleetwood)
Demographics: 72/5/20/2
Prez ’12: Obama 55-43
Average: 56-44 Democratic
This district is based in Reading, and contains most of its suburbs as well as a few outer townships and the small town of Fleetwood, home to Schwank. She dramatically outperformed Obama in 2012, so she should be just fine. SAFE D.
District 31 (khaki): Mike Folmer (R-Lebanon)
Demographics: 93/1/5/1
Prez ’12: Romney 64-34
Average: 64-36 Republican
This district contains all of Lebanon County, as well as the remaining (conservative) parts of Dauphin, southern Northumberland, and western Schuylkill and Berks. This is a bunch of right-wing exurbs, conservative rural areas, and Amish people, so Folmer is completely safe. SAFE R.
District 32 (orange-red): Open Seat
Demographics: 95/1/2/1
Prez ’12: Romney 59-40
Average: 56-44 Republican
This district includes southeastern Schuylkill County, most of the rural areas in Berks County, and the northern parts of Lehigh and Northampton Counties. No incumbents live here, but Republicans would win this district easily. SAFE R.
District 33 (royal blue): Lisa Boscola (D-Bethlehem Township)
Demographics: 80/5/11/3
Prez ’12: Obama 56-43
Average: 58-42 Democratic
This district is one of two Democratic districts in the Lehigh Valley. This one is based in Northampton County and includes Bethlehem and Easton. Boscola is popular here, and has outperformed Obama, so she should be safe. SAFE D.
District 34 (lime green): Pat Browne (R-Allentown)
Demographics: 71/5/19/3
Prez ’12: Obama 56-43
Average: 57-43 Democratic
This district is the other Democratic Lehigh Valley district. It is based in Allentown and takes in all of its major suburbs, from light-blue Whitehall to purple South Whitehall to light-red Lower Macungie. Browne has experience winning Democratic-leaning districts, however he loses some of his strongest areas in the northwestern part of the county. In an open-seat scenario, this district would go Democratic fairly easily, but due to Browne’s popularity, this district is a TOSSUP.
District 35 (dark orchid): Tommy Tomlinson (R-Bensalem Township)
Demographics: 83/6/5/5
Prez ’12: Obama 58-41
Average: 59-41 Democratic
This district is basically lower Bucks County. It contains Bensalem, Bristol, Falls, Middletown, and Lower Makefield. Tomlinson is a strong incumbent, but he loses Northampton and Warwick, which are some of his strongest areas. He’s no pushover, but I doubt he could survive a district like this. LEAN D with Tomlinson, SAFE D if open.
District 36 (orange): Open Seat
Demographics: 92/1/3/3
Prez ’12: Romney 53-46
Average: 52-48 Republican
This district is basically the central part of Bucks County. It is significantly more Republican than the 35th, as it contains Northampton, Warwick, Warrington, and Buckingham, all conservative areas. Chuck McIlhinney lives just over the border in the 42nd, but he’d probably run here to allow Bob Mensch to run in the 42nd. Republican state legislative candidates routinely outperform the top of the ticket here, so McIlhinney or any other Republican would be safe here. SAFE R.
District 37 (dodger blue): Dominic Pileggi (R-Chester)
Demographics: 72/22/3/2
Prez ’12: Obama 63-35
Average: 60-40 Democratic
This district, located entirely in Delaware County, contains Chester, Middletown, Media, Ridley, and Darby. This district swung a point toward Obama in 2008, and is actively participating in Delaware County’s blue trend. Pileggi survived 2012 only by running up the score in the conservative exurban townships west of Chester; most of those are now in the 39th. Even with Delaware County’s stubborn Republican-ness at the local level, it’s hard to see a Republican winning a district that is 22 percent black and voted for Obama by 28 points. LIKELY D with Pileggi, SAFE D otherwise.
District 38 (medium aquamarine): Open Seat
Demographics: 73/16/3/7
Prez ’12: Obama 61-38
Average: 58-42 Democratic
This district is also entirely in Delaware County, and includes Radnor, Haverford, Marple, Springfield, Upper Darby, Lansdowne, and Yeadon. No incumbents live here, but both Democrats and Republicans have several strong candidates who could run here. However, it would be difficult for a Republican to win here due to the strongly Democratic areas of eastern Upper Darby, Lansdowne, and Yeadon. Democrats would be strongly favored here, but due to the Republicans’ machine in Delaware County, I’ll call this LIKELY D.
District 39 (moccasin): Ted Erickson (R-Newtown Township)
Demographics: 86/5/6/3
Prez ’12: Romney 55-44
Average: 55-45 Republican
This district contains the remaining (conservative) areas of Delaware County, plus some of the Republican areas of Chester County. It loops around the more Democratic areas of Chester County that are in the 40th. Erickson is retiring this year, but whoever wins here will certainly be a Republican. SAFE R.
District 40 (firebrick): Andy Dinniman (D-West Whiteland Township)
Demographics: 82/8/5/5
Prez ’12: Obama 54-45
Average: 53-47 Democratic
This district, located entirely in Chester County, includes most of the Democratic areas of the county. It roughly follows the Lancaster Pike, and includes Coatesville, Downingtown, West Chester, and Phoenixville. Dinniman is a strong incumbent who outperformed Obama in 2012, so as long as he’s there, Democrats don’t have to worry much about this seat. SAFE D with Dinniman, LEAN D if open.
District 41 (light steel blue): John Rafferty (R-Lower Providence Township), Daylin Leach (D-Upper Merion Township)
Demographics: 85/6/3/6
Prez ’12: Obama 55-43
Average: 55-45 Democratic
This is a strange district. It includes the conservative northern townships of Chester County, Pottstown and its surrounding townships, and then goes southeast along the Schuylkill to include Upper and Lower Providence and Upper and Lower Merion. Ultimately, the district is dominated by the latter two, which make up most of the Democratic base. In a matchup between Rafferty and Leach, Leach would be favored, but he would not be guaranteed to win. LIKELY D if held in a presidential year, LEAN D if in a midterm year.
District 42 (lawn green): Bob Mensch (R-Marlborough Township)
Demographics: 94/1/2/2
Prez ’12: Romney 56-42
Average: 56-44 Republican
This district contains the remainder of Bucks County, the few remaining townships of Berks and Lehigh Counties, and the most conservative areas of Montco. This is the last Republican district on the map. SAFE R.
Here is a map of Philadelphia:
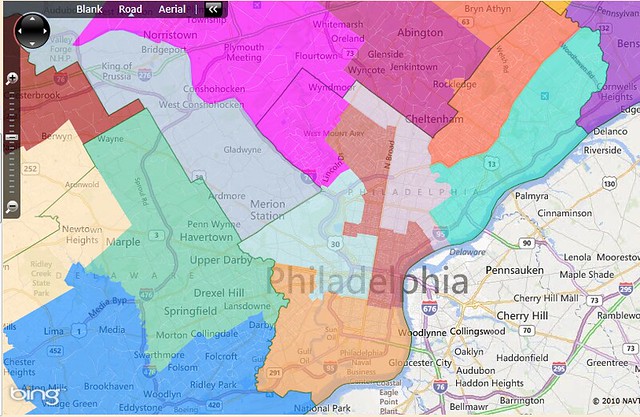
District 43 (magenta): Open Seat
Demographics: 77/12/6/4
Prez ’12: Obama 61-37
Average: 61-39 Democratic
This district is in central Montco and includes Perkiomen, Skippack, Worcester, Whitpain, East and West Norriton, Norristown, Whitemarsh, Plymouth, and Springfield, plus wards 9 and 21 of Philadelphia. No incumbents live here, but Democrats dominate this district, and a Democrat would easily win here. SAFE D.
District 44 (orange-red): Open Seat
Demographics: 78/10/3/9
Prez ’12: Obama 60-39
Average: 59-41 Democratic
This district is entirely in Montco, and includes Cheltenham, Abington, Upper Dublin, Horsham, Upper and Lower Gwynedd, Montgomery, Hatfield, and Towamencin. Philadelphia state senator LeAnna Washington is retiring this year, and her almost-certain replacement is Art Haywood, who lives in Cheltenham and who would represent this district. That way, no one else in Philly needs to be cut. But a district with Abington and Cheltenham is not going to vote for a Republican. SAFE D.
District 45 (turquoise): Mike Stack (D-Philadelphia)
Demographics: 66/18/11/4
Prez ’12: Obama 68-31
Average: 65-34 Democratic
This district contains nine wards of Philadelphia, mostly in Northeast Philly. Stack will almost certainly be elected Lieutenant Governor in November, which would create a vacancy here. Maybe Larry Farnese could escape here if he doesn’t want to represent a black-majority district. This area swung heavily to Obama in 2012, having given Obama only 63 percent in 2008. Any Dem would be safe here. SAFE D.
District 46 (tomato): Christine Tartaglione (D-Philadelphia), Stewart Greenleaf (R-Upper Moreland Township)
Demographics: 66/13/9/10
Prez ’12: Obama 63-35
Average: 62-37 Democratic
This district takes in Upper and Lower Moreland in Montco, and then includes six wards of Philadelphia. Greenleaf, the longest-serving current member of the state senate, is absolutely screwed under this map, as he would have no chance either here or in the 44th, which overlaps with much of his current district. Tartaglione would easily win here. SAFE D.
District 47 (thistle): LeAnna Washington (D-Philadelphia), Shirley Kitchen (D-Philadelphia)
Demographics: 11/51/31/5
Prez ’12: Obama 95-4
Average: 91-9 Democratic
This district includes eleven wards of Philadelphia, stretching from the 50th next to Wyndmoor to the 25th bordering the Delaware River. Washington is retiring, so Kitchen should be able to win this district easily. This is the first of four black-majority districts in Philadelphia on this map. SAFE D.
District 48 (sandy brown): Anthony Williams (D-Philadelphia)
Demographics: 33/51/5/9
Prez ’12: Obama 89-11
Average: 87-13 Democratic
This district contains ten wards in the southern part of Philadelphia. It ranges from the right-leaning, heavily white 26th ward to the liberal 1st ward to the heavily African-American 3rd and 60th wards. It’s relatively compact, and has a majority of African-Americans. Williams would cruise here. SAFE D.
District 49 (indian red): Larry Farnese (D-Philadelphia)
Demographics: 34/53/6/5
Prez ’12: Obama 92-7
Average: 91-9 Democratic
This district includes fourteen wards that stretch from Germantown through North Philly to Kensington and Center City east of Broad St. It is ironic that Larry Farnese, who is white, is given the most African-American district on the map. But since there needs to be four African-American districts here, there’s really no way of avoiding it. Farnese could carpetbag to the 45th once Mike Stack vacates it to become LG, or he could pull a Steve Cohen and represent his constituents well enough that they don’t primary him. Either way, a Democrat will represent this district. SAFE D.
District 50 (powder blue): Vincent Hughes (D-Philadelphia)
Demographics: 36/51/4/7
Prez ’12: Obama 91-8
Average: 90-9 Democratic
This district includes fourteen wards that take in a large chunk of West Philly, as well as University City, Center City west of Broad St, Fairmount, and some of East Falls. I don’t think there’s a single Republican precinct in this district. Hughes will win re-election easily. SAFE D.
Thus, this map includes:
18 SAFE D (1,5,6,7,9,21,22,30,33,40,43,44,45,46,47,48,49,50)
9 LIKELY D (2,3,4,11,16,17,37,38,41)
2 LEAN D (8,35)
2 TOSSUP (20,34)
1 LEAN R (19)
0 LIKELY R
18 SAFE R (10,12,13,14,15,18,23,24,25,26,27,28,29,31,32,36,39,42)
It is clear that this map would be a huge improvement over the current one, with which it will be extremely difficult for Democrats to get a majority. Therefore, if the Democrats ever have the opportunity to redraw the Pennsylvania State Senate, this is the map they should use.
I hope you enjoyed reading, and I welcome any questions, comments, concerns, or ideas!

