Crossposted at Politicook.net
Go ahead, admit it. You have watched CSI, or, better, the shows on what used to be called Court TV (now "Tru", what is up with that?) about how science and technology can solve crime. And it can, when used properly.
Unfortunately, most jury members are low information people when it comes to how these technologies work, and the prosecution knows it. This time I want to demystify one of the techniques that you hear about all of the time.
This is called gas chromatography/mass spectrometry (GCMS). Without going into the history of mass spectrometry (it was a Nobel winner decades ago), here is what they are talking about.
Chromatography (from the Greek chromos (color) and graphein (writing)) is a term used to describe a universe of separating complex chemical mixtures into individual components. There are many ways to do this, but all of the techniques have a couple of features in common. By the way, this term was coined when some researchers separated different species of chlorophyll, and those were colored a bit differently, so could be identified by the human eye, hence "color writing".
All chromatographic systems consist of these elements: a stationary phase, a mobile phase, and the material to be separated. This sounds complicated, but it is not. Here is an experiment that is easy to do, and is a classic.
Take a piece of paper (I fooled around with several. A coffee filter was too fast, and printer paper too slow. I finally took white construction paper, washed out the sizing with dishwashing detergent and water, and dried it. Laboratory filter paper is best, but I wanted something that everyone could get their hands on). Cut a strip about 4 inches long and a quarter of an inch wide. Be careful handling it, because oils from your fingers can mess up the results. It is important to get it square. Take a paper plate and tape the top end of the strip in the middle of the plate, then bend the strip so that is will hang down when the plate is put on top of a kitchen tumbler. You might want to make a couple of them for practice. Now, put water in the tumbler deep enough that the bottom quarter inch or so of the strip will dip into the water. You just need the strip barely in the water. That is why you should make a couple, to get the depth right. The strip that you will use for the experiment needs to be dry.
Now, take a toothpick (I shaved mine down a tad to make a smaller spot) and get a tiny drop of red food coloring on it. (I used Great Value red, which is a mixture of Red 3 and Red 40) and make a tiny spot on the strip about a quarter of an inch above where the water will come. Higher is OK, but if you put the spot below the water level this will not work. The smaller the spot, the better. Big spots just smear.
Let the spot dry for a few minutes, then mark the location of it with a pencil. Carefully lower the strip into the tumbler of water. You will see that the paper starts to wick the water up slowly, and it soon will encounter the spot. When that happens, the water will carry the spot up with it, but then something incredible happens. The spot will begin to separate into different spots, each of a different color. As the water wicks towards the top, the different colors separate further apart. When the strip wicks the water far enough that the two spots have separated, take it out and mark the water line before it drys. Let the strip dry (preferably without any contact on the wet strip, you can take a paperclip and clip it to something that will allow the strip to dry just in the air. I used a hair dryer).
Congratulations! You just performed chromatography! I encourage everyone to try this. It costs next to nothing, and is not only educational, it is fun. Before you know it, you will be testing other food colors and asking people for different pens (be sure that the ink is water soluble), and might just become a researcher.
Here are some pictures of my experiment:
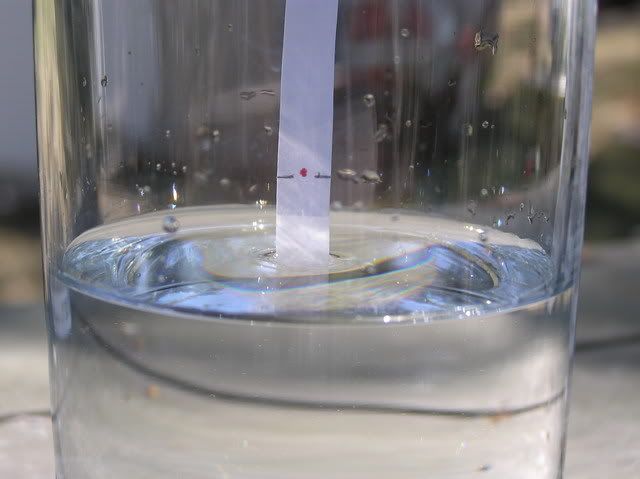
Before water
hit spot
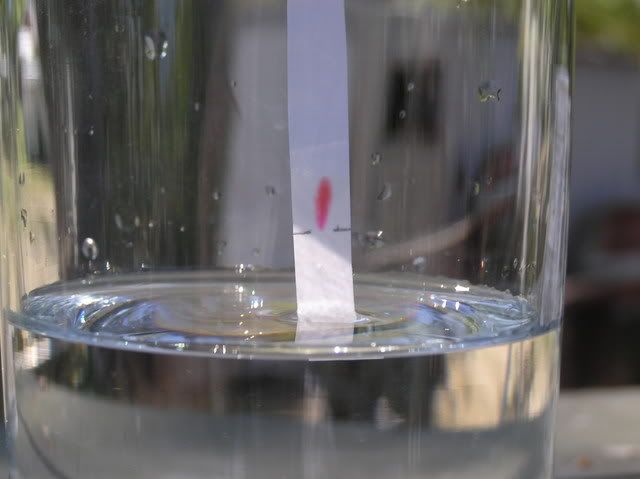
After about 2
Minutes
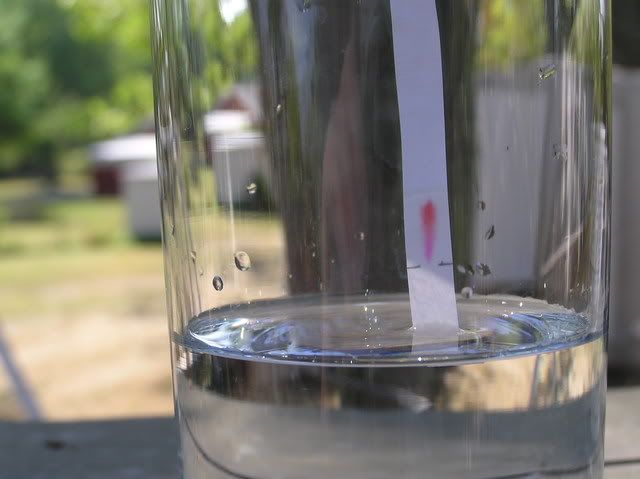
After about 5
Minutes
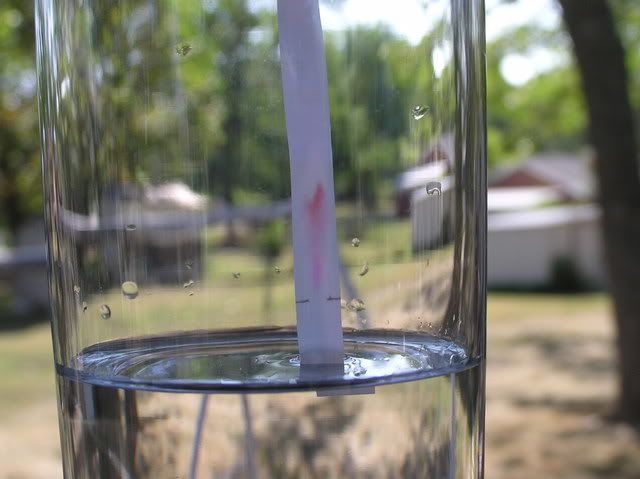
Done after about
10 Minutes
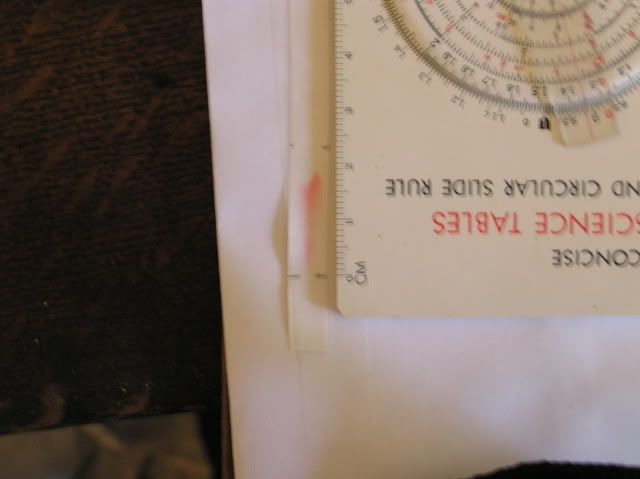
Measuring with my circular slide
rule (I got it in high school)
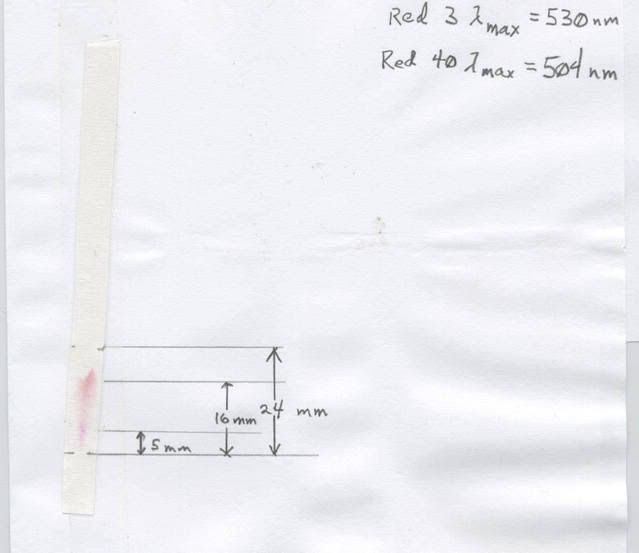
Data page
Here is what we have learnt: the paper is the stationary phase, because it does not move. The water is the mobile phase, because it does move. The ink spot is the is the material to be separated, also know as the analyte. The finished, dried strip is the chromatogram. What just happened?
Water soluble inks are composed of several different dyes, and they have differing solubilities in water. In addition, they have different affinities for paper (shame on you who did not read last weeks installment about carbohydrates!) because of hydrogen bonding differences. So, the mobile phase tries to dissolve the analyte and move it up the paper. The paper has different "stickinesses" for the different components, so they separate into distinct colored spots, each of which is a different dye in the ink.
In this case we know that the color was a mixture of Red 3 and Red 40. Not as obvious unless you are familiar with spectra of dyes is that the Red 40 looks "pinker" than the Red 3, to the Red 3 went 16 mm, the Red 40 5 mm, and the water 24 mm. (It is a little subjective because of the smearing. I tried to estimate the center of the spots). The retention index of a component is the distance the spot travels divided by the distance the water travels. Therefore, under these condition, Red 3 has a retention index of 0.67 and Red 40 has one of 0.21. In actual practice, spots of known, pure materials would be used to establish standard retention indices.
All chromatography works this way. Originally I was going to describe mass spectrometry, but I should keep attention turned towards chromatography, then talk about mass spectrometry next time. There are two types of chromatography in general use: gas chromatography and liquid chromatography. There are many other types, but these are the ones that you see on TeeVee most of the time.
Gas chromatography is good for separating materials that are easy to vaporize, like solvents (it is often used in arson investigations), volatile blood and urine components (very often used in drugs analyses), and other volatile residues. Liquid chromatography is good for nonvolatile or heat sensitive materials, like sugars, gunpowder residue, and the like. A related technique is used for DNA, but this is complicated enough already.
In gas chromatography, a tiny sample is injected onto the end of a column, now almost always a very long, narrow fused silica tube coated with one of many stationary phases, depending on the substance to be determined. The longer and more narrow bore, and the thinner the stationary phase, the better the resolution. Resolution is the separation of closely related components.
Typically, the material is vaporized in an injector port, and then swept onto the column by helium gas (the flash vaporization method). In some cases the material is injected directly onto the end of the column itself (the cool, on-column method). In any event, a carrier gas (like the water in our earlier experiment) acts as the mobile phase. Most often helium is used, but other gases can be used as well, depending on the technique. The column is suspended in an oven that is temperature controlled. The temperature is typically above the boiling point of the least volatile expected component, but there are exceptions. In one scheme, the oven temperature is held steady (the isothermal technique), whilst in another the temperature is ramped up over time (the temperature programmed technique). It is possible to vary the pressure of the incoming carrier gas, so pressure programming is also possible.
At the end of the column, the separated components enter a detector, where they are registered and, usually, quantitated. Unlike paper chromatography, which only tells the retention index, most detectors for gas chromatography can also measure the amount of material passing through. The amount of time required for a particular component to pass from the injector port to the detector is called the retention time, and is characteristic for a given component, but there exists the possibility of overlap with other components. Standard solutions of known materials at known concentrations and solvents are run through the instrument before unknowns are run for calibration of retention times and signal intensities.
The detector is connected to some sort of a recorder, that takes the signal and plots the shape of it, and calculates the areas (typically, but sometimes the height) of each signal, called peaks. This is compared to the calibration runs, and a quantitative result is calculated and displayed. Modern practice is almost always to use a computer to capture the data, but in the old days a strip chart recorder was used, and the areas of the peaks had to be calculated by hand. I have done that, by the way.
Here are some graphics with schematics of how a gas chromatograph operates, along with some of the associated hardware, and a typical chromatogram:
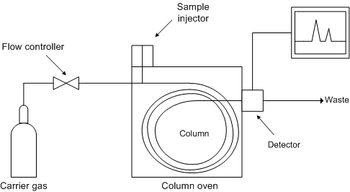
This is a block diagram of
a typical GC system. LC is similar
except that containers of liquid eluant
and high pressure pumps replace the
cylinder of gas and the flow controller,
and the column is a straight metal tube.
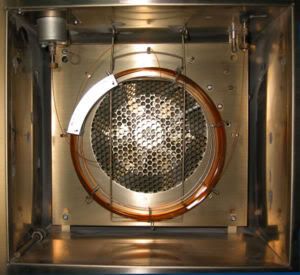
Typical capillary column on its hanger.
It might be one hundred meters long.
The oven appears to be an Agilent model,
formerly Hewlett-Packard. Spinning off
the analytical instrument division was one
of the most incredibility stupid business
moves ever.
There are hundreds of types of stationary phases, and each has its advantages and disadvantages. Many of them sort out compounds by boiling point, and many others sort them by polarity. There is a bit of boiling point sort in any stationary phase, but sometimes it is less important that other properties. There are even columns that sort enantiomers by chirality. I will trust the commenters to expound on this.
Here is a typical forensic sample, cannabinoid metabolites in urine:
The peaks are:
- cannabidiol
- Δ8-tetrahydrocannabinol
- Δ9-tetrahydrocannabinol
- cannabinol
- 11-hydroxy-Δ9-tetrahydrocannabinol
- 11-nor-Δ9-tetrahydrocannabinol carboxylic acid
The bottom scale is time in minutes.
There are many types of detectors for GC, and each has its advantages and disadvantages. Several qualities are important in detectors, including selectivity, dynamic range, response rate (also called slew rate), universality, and stability. Next time I will go into detectors. This time I want to concentrate on the separation techniques.
High performance liquid chromatography (HPLC, also called high pressure liquid chromatography, but the original developers were muscle car enthusiasts) takes our little paper experiment to the extreme. As I said before, liquid chromatography is well suited to separating nonvolatile materials.
As I said, the principle is similar to that of GC, but since the mobile phase is a liquid under high pressure, the columns are very different. Here is a picture of various HPLC columns:
The bigger ones are for preparative work,
using the instrument to separate relatively
large amounts of materials for other work
In a typical HPLC, a sample is injected onto a column composed of a fine powder coated, usually, with modifiers. In normal phase HPLC, the powder is usually silica, which is highly polar. This is the stationary phase. A solvent, often water, mixtures of water and other solvents, or even nonaqueous solvents is then pushed through the column at high pressure. Depending on the particular setup, the mobile phase can be polar or nonpolar. Just like our paper experiment, components are separated because of different solubilities in the solvent (called the eluant, and it is the mobile phase) and attraction for the stationary phase.
The other major method is reversed phase HPLC, where the stationary phase has been modified to be nonpolar, and the mobile phase can be either polar or nonpolar. As with normal phase HPLC, the mobile phase acts in concert with the stationary phase to separate components.
Extremely detailed control can be had with HPLC. The stationary phase can be selected, and even though there is not as much variety as there are in GC, there is still lots of choices. In addition, the composition of the mobile phase can be changed during the run, essentially washing unimportant components from the column off before the ones of interest are eluted. This is called gradient HPLC, and is extremely widely used. Since the solubilities of materials changes with temperature, the column can be placed in an oven and the temperature maintained constant. This reduces drift in retention times as the room changes in temperature. The use of the gradient technique gives an entirely dimension not possible with GC. Also, the pressure of the pump can be programmed just like in GC, so it is possible to bring even another level of control.
Cost, substances being analyzed, and the end result come into play when deciding what technique to use. In general, GC is less expensive from a capital standpoint than HPLC is since in GC the helium cylinder provides the gas pressure needed to make the system run. In HPLC, high pressure liquid pumps are necessary, and those are expensive and maintenance intensive. GC is easier to learn, since there are fewer variables. HPLC is much more art, and good HPLC jocks are rare. On the other hand, HPLC is not good for volatile materials, and GC is not good for nonvolatile ones.
Here is an HPLC trace of a mixed opiate sample:
The peaks are:
- morphine
- oxymorphone
- hydromorphone
- codeine
- 6-monoacetyl morphine
- oxycodone
- hydrocodone
Both of these techniques, and others related to them, are extremely powerful tools for separating and quantitating components in complex mixtures. However, it is always possible for interferences to occur. There are positive interferences, that artificially add to the signal, and negative interferences, that artificially reduce the signal. Obviously, both degrade the validity of the results of an analysis. Note the peak for #5 is only a shoulder in front of #6. There are ways to deal with these situations.
The most common positive interference is coelution. That is a component not of interest that by coincidence hits the detector at the same time that the one of interest does. The higher the resolution, the lower the probability of this, but it still can happen. With a detector that can not discriminate between the two, this can be a huge problem.
The most common negative interference is degradation of the component of interest by the conditions in the column. Running good standard calibrations is the best defense, but it does not always work. Sometimes the material from which the unknown is extracted interacts with it on the column, whilst the standards, in a pure solvent, do not. The technique of matrix matching helps to eliminate this, but does not solve the problem entirely. Matrix matching means that the standards are in a solution similar to that of the unknown.
Another method is to use spiking, where known quantities of chemically similar substances are introduced into the actual sample. Recoveries of the spike material can be used to adjust the results for the unknown materials, and correct for both positive and negative biases. However, just because a material is similar chemically does not mean that is identical.
The best spiking protocols involve isotopically-labeled materials that are chemically identical to the unknowns to quantify. When that is done, a true picture of biases can be had. The most common materials are, for organic materials, ones that have been tagged with deuterium (heavy hydrogen) or carbon-13. This technique removes almost all of the error, but requires a detector than can discriminate by molecular mass, which I will cover next time.
I have said nothing about sample collection nor sample preparation, and these are as crucial as any other step in the process. Next time I will talk about detection methods, and then, if there is enough interest, the sample part.
Update: I cleaned up some verbiage and made the chromatograms a little bigger to be easier to see.
Warmest regards,
Doc
