Expanded chart here; but does not include November data.
http://nsidc.org/...
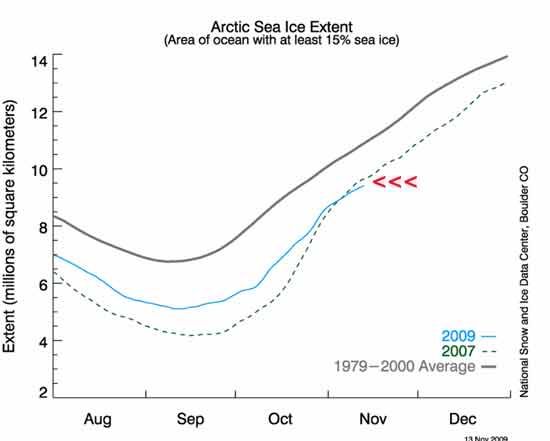
This graph represents the 15% level of ice present in the Arctic, over time by month of the year, and superimposed data points from previous years are as indicated.
What the red arrows point out is the we have hit a new record low for this period of time, in mid November for the accumulation of ice that reforms as winter tightens it's grip on the Arctic. Weather fronts and conditions [apparently] have forced enough warm air into the polar regions to delay the freezing that would normally be expected during this period of time.
It's not as spectacular as having summertime Northwest and Russian passages open across the polar region, or having no ice left at all in the Arctic, but it's another indicator that some is amiss with our polar climate.
(I don't have a lot of time to post a detailed diary, so I am using some of my older work and comments you may have seen below as part of this diary. I may not be around to interact much this evening.)
The import and meaning of that chart above may be transitory; perhaps the formation of ice recovers to a more normal level later in the season. Perhaps not.
But I feel it's important to repeat some of the points I made in earlier comments and diaries, so people can try to get a grasp of what we are potentially facing in the future, perhaps a future coming a lot quicker than we thought.
--------------
People talk of CO2 because it is one valid measurement of the potential for change in our atmosphere. CO2 makes up the significant portion of highly variable greenhouses gases, and gets the most attention.
But I feel that in the short term, we've got methane production as probably the number one threat, because it has its own series of catastrophic feedback loops, atmospherically. Methane levels in the upper atmosphere [where it does the most damage in terms of a GHG] is regulated by solar/cosmic dynamics, up to a point.
I did a diary on this a while back:
http://www.dailykos.com/...
This article really expresses some of concern expressed by some in the scientific community.
http://www.sciencedirect.com/...
We have constructed a record of atmospheric methane (CH4) over the last 10,000 γ which shows that CH4 has increased to more than double the natural levels of a century ago.
Our observations and calculations show that the concentrations of CH4 remained virtually unchanged over thousands of years until about a few hundred years ago. Until the beginning of the 18th century there is no evidence of significant trends. Between 1700 and 1900 CH4 increased slowly at an average rate of about 1.5 ppbvy−1, between 1900 and 1925 CH4 increased by about 2.2 ppbvy−1, between 1927 and 1956 by 6.4 ppby y−1, between 1962 and 1973 by about 11 ppbvy−1 and during the last decade it has increased at a rate of about 17 ppbvy−1. We explain these rates of increase by a global mass balance model. In the model, the increase of emissions from sources affected by human activities is taken to be proportional to the population and the atmospheric lifetime of CH4 is taken to be increasing if human activities are slowly depleting OH radicals that remove CH4 from the atmosphere.
OH radicals are the atmosphere's 'cleaners'.
They are generally provided at a constant level, and the time of the 'half-life' of the existence of methane in the upper atmosphere is regulated by a steady state mechanism of incoming energetic solar and cosmic radiation working in conjunction with these OH radicals. As energetic particles impinge upon the OH radicals they serve to help break methane down. Some variability in the methane levels can be accommodated, up to a point by the huge sink in the upper atmosphere. But as far back as 25, 30 years ago [and even longer] some scientists were concerned we could approach that upper limit.
The process by which this breakdown occurs has a limit; as more methane is pumped into the 'reaction chamber', the process of breakdown of CH4 does not change, since the radiation which starts the reaction remains constant. This effectively lengthens the half-life period of persistence of methane as a greenhouse gas [GHG].
Let me remind folks that methane is 20 to 25 times more potent by weight than CO2 as a GHG. The half-life of how long it exists in the atmosphere is crucial to determining how much effect it has as a GHG. The longer the half life, the more potential for warming it has.
If, and when we start to effect the length of that 'half-life' of methane in the upper atmosphere, a runaway cataclysmic planetary dynamic will be engaged, a truly horrendous feedback loop.
I believe we have already entered into that lengthening of the half life, and there's simply not enough data to know how close we are to a runaway event. Stored methane present in permafrost is melting, adding to the load. Nodules of methane clathrates which exist on the floor of the ocean in huge quantities are being subjected to changing temperature and ocean current dynamics.
1991
http://findarticles.com/...
2004
http://www.springerlink.com/...
2000
http://www.igac.noaa.gov/...
When one combines this potentially alarming information with the knowledge that methane is being released at increasing rates from melting permafrost with an increase in the time of the 'half-life' of breakdown of methane ..
http://www.realclimate.org/...
the conclusions I have to reach are very bad.
We are staring right into the abyss of a planetary catastrophe;
and there's nothing we can do to stop it now. The changes we are witnessing are more than a warning, it's a planetary Red Alert, and dammit, we're asleep at the switch.
I see what is happening with Copenhagen and I am quickly losing what little hope I had remaining.
updated a little for syntax de-obfuscation, and a little clarity on some points
0:24 EST
