Yesterday, we had a very interesting discussion about the importance of the electoral college "map" vs. national polling. I quoted Andrew Gelman, who said that "in 2008 the red/blue map was not redrawn; it was more of a national partisan swing [...] The past several decades have seen a steady decline in the variation of statewide vote swings.[...] To put it another way, the red-blue map is much more stable from election to election than it used to be."
tommypaine, for one, disagreed, saying "Swings are getting far less uniform, not more." Gelman actually agreed that the variance in swing increased from 2000-2004 to 2004-2008. While I can't address at this question with full historical comprehensiveness, I wasn't satisfied with looking state-by-state. States, of course, have large variance in size and internal diversity. Why don't we look by Congressional district? We'll also look at what districts Obama and Kerry "should have" won by uniform national swing, and how the results differed.
I am using, of course, the invaluable Presidential Results by CD post from SSP, which means all results are rounded to the nearest integer.
Let's start with the simplest possible approach. I've looked at Bush's 2004 percentage minus Bush's 2000 percentage in each district, as well as McCain's 2008 percentage minus Bush's 2000 percentage. (I don't think I need to account for Nader's 2000 campaign, with this approach.)
To make it easier to directly compare the swings visually, I've "normalized" each one by simply subtracting the national swings. Bush got 48%, then 51%, and then McCain got 46%, so I subtracted 3 from the 2000-2004 swings, and added 5 (i.e., subtracted -5) from the 2004-2008 swings, and I've sorted each year independently from smallest to largest. That way, there "should" be an average swing of 0 in each case, and the graphs should sit on top of each other, allowing us to easily compare the variance.
Here is the result:
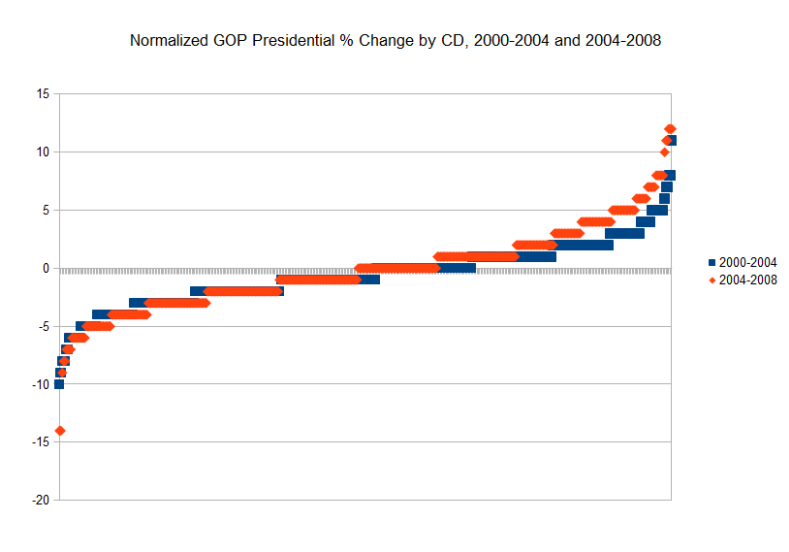
With the red dots generally above the blue line, this would seem to support tommypaine's theory that swings got less uniform between 2000-2004 and 2004-2008.
However, it occurred to me that there was an important difference in the 2000-2004 swings and the 2004-2008 swings: the Republican nominees were constant from 2000-2004 and varied from 2004-2008. I thought this might mean that the "home state effect" explained things, but I made an additional chart removing all the home states, and that didn't change the effect. (In fact, it added a bit of variance on the low end.)
Gelman and tommypaine, then, are both right--even at the CD level, there was somewhat greater variance in swing from 2004-2008 than from 2000-2004. Still, some of this probably is explained by the constancy of the Republican nominees from 2000-2004.
Let's look more specifically, though. The difference between the two, I think, is largely on the positive end.
There were 43 CDs with non-negative change in the GOP Presidential percentage from 2004-2008, which translates to a normalized swing of at least 5. Here they are, along with the (normalized) swing, and mostly with the labels they had on SSP:
1 OK 2 Boren 12
2 AR 4 Ross, Mike 12
3 AR 1 Crawford 12
4 TN 4 DesJarlais 11
5 KY 5 Rogers, Hal 11
6 AL 4 Aderholt 10
7 WV 3 Rahall 8
8 TN 8 Fincher 8
9 MA 9 Lynch 8
10 LA 7 Boustany 8
11 LA 3 Landry 8
12 AR 2 Griffin 8
13 TX 8 Brady, Kevin 7
14 TN 6 Black 7
15 TN 1 Roe 7
16 MA 4 Frank 7
17 LA 1 Scalise 7
18 AR 3 Womack 7
19 TN 3 Fleischmann 6
20 PA 18 Murphy, Tim 6
21 PA 12 Critz 6
22 PA 4 Altmire 6
23 OK 3 Lucas 6
24 MA 10 Keating 6
25 LA 2 Richmond 6
26 AL 5 Brooks 6
27 TX 1 Gohmert 5
28 TN 2 Duncan, John 5
29 NY 9 Turner 5
30 NY 5 Ackerman 5
31 NY 3 King, Peter 5
32 MS 4 Palazzo 5
33 MS 1 Nunnelee 5
34 MA 7 Markey 5
35 MA 6 Tierney 5
36 LA 5 Alexander 5
37 LA 4 Fleming 5
38 FL 22 West 5
39 FL 20 Wasserman Schultz 5
40 FL 19 Deutch 5
41 FL 2 Southerland 5
42 AZ 2 Franks 5
43 AZ 1 Gosar 5
Meanwhile, there were only a few CDs with a normalized swing of at least 5 from 2000 to 2004:
1 NY 9 Turner 11
2 TN 6 Black 8
3 NY 13 Grimm 8
4 AL 4 Aderholt 7
5 NJ 4 Smith, Chris 7
6 NY 8 Nadler 6
7 TN 4 DesJarlais 5
8 NY 3 King, Peter 5
9 RI 2 Langevin 5
10 NJ 6 Pallone 5
11 NJ 3 Runyan 5
12 CT 3 DeLauro 5
13 CA 47 Sanchez, Loretta 5
14 HI 2 Hirono 5
15 HI 1 Hanabusa 5
Essentially, Obama seems to have had a more pervasive "regional problem" relative to Kerry than Kerry had relative to Gore.
Now, James Allen thought that Obama might currently be losing ground in states that "don't really matter", explaining some of the potential discrepancy between state and national polling.
This gave me another idea. Say I just added the national 2004-2008 swing to Kerry's -performance and looked at the districts Obama "should have" won. How wrong would I be?
Basically, Obama won, but "should have lost", something like the following 21 districts:
CA 3 Lungren
CA 24 Gallegly
CA 25 McKeon
CA 26 Dreier
CA 44 Calvert
CA 45 Bono Mack
CA 48 Campbell
CA 50 Bilbray
IL 8 Walsh
IL 14 Hultgren
IL 16 Manzullo
IN 2 Donnelly
KS 3 Yoder
MI 4 Camp
NE 2 Terry
TX 23 Canseco
VA 2 Rigell
VA 4 Forbes
VA 10 Wolf
WI 6 Petri
WI 8 Ribble
We have a few examples of possible home state effects (IL-08, IL-14, IL-16, TX-23) a few possible campaign effects (IN-02, NE-02, perhaps the CA districts and the VA districts), and so on.
Obama lost, but "should have won", something like the following 20 districts:
AR 1 Crawford
AR 2 Griffin
AR 4 Ross, Mike
AZ 1 Gosar
AZ 5 Schweikert
AZ 8 Giffords
FL 2 Southerland
FL 16 Rooney
MN 2 Kline
NY 3 King, Peter
OH 3 Turner
OH 6 Johnson, Bill
OH 14 LaTourette
OH 16 Renacci
PA 3 Kelly
PA 4 Altmire
PA 12 Critz
PA 18 Murphy, Tim
TN 8 Fincher
WV 3 Rahall
Again, we have a few home state effects (the AZ districts) and many of the rest are Appalachian.
Meanwhile, I'm not sure about these 2 McCain districts, since they come out to a tie:
FL 24 Adams
NY 13 Grimm
Same with these three Obama districts:
FL 8 Webster
IL 13 Biggert
TX 27 Farenthold
That means there were about 41-46 districts that uniform national swing would have gotten wrong from 2004 to 2008.
Same exercise for Kerry and 2000-2004? It's a bit trickier because of Nader, but what the hell, I'll give it a try. Kerry won, but "should have lost", these 8 districts:
CO 7 Perlmutter
FL 22 West
KY 3 Yarmuth
NC 13 Miller, Brad
OR 4 DeFazio
PA 6 Gerlach
PA 15 Dent
TX 25 Doggett
I feel like there's something that KY-03, NC-13, OR-04, and TX-25 have in common, but I'm not quite sure what, since my knowledge here is very vague. Any suggestions?
Kerry lost, but "should have won", these 8 districts:
CA 18 Cardoza
CA 47 Sanchez, Loretta
NJ 2 LoBiondo
NJ 3 Runyan
NY 1 Bishop, Tim
NY 3 King, Peter
NY 13 Grimm
TX 15 Hinojosa
Perhaps the CA and TX districts are explained by some combination of Bush's relative strength in the Hispanic vote (although, did that increase from 2000 to 2004?). Any other ideas?
I'm not sure about these 2 Bush districts:
NJ 4 Smith, Chris
WV 3 Rahall
nor these 11 Kerry districts:
IL 10 Dold
ME 2 Michaud
NH 2 Bass, Charlie
NM 1 Heinrich
NY 25 Buerkle
PA 7 Meehan
PA 8 Fitzpatrick
WA 2 Larsen
WA 8 Reichert
WI 3 Kind
WI 7 Duffy
That makes 16-29 districts that "uniform national swing" might have gotten wrong this time, although I have no idea, really, thanks to Nader, if I did that right. Take it as a vague suggestion.
4:51 PM PT: By the way, if you click through the Gelman link, you'll see a scatterplot he did by state of Obama's percentage vs. Kerry's. It bolsters the idea that 2008 was more notable for where Obama didn't do well than for where he did, since the outlier states are mostly below the best-fit line.
Note: I originally misidentified FL-08 as a McCain district and FL-24 as a district Kerry lost but should have won. It wasn't--but I think NY-13 was, as Gore won it 52-44. I've replaced FL-24 by NY-13 and checked everything else, as well as redoing the chart (although I think it's the same chart) just to be sure.
6:28 PM PT: Oh, and I had AK-AL a couple of places it shouldn't have been as well--probably because it was alphabetically first, and Excel/OpenOffice can get confused when that's the case.
