Introduction
As you may be aware, climate models have predicted that anthropogenic global warming would be largest in the northern hemisphere Arctic, amplified by 2-3 times over the warming in tropical regions. This diary is a continuation of an irregular series I've been doing, initially inspired by JohnnyRook, a great advocate of action to reduce our impact on the environment. He's no longer with us, but I have endeavored to continue these diaries to keep folks informed of the impacts of global warming/climate change on Arctic sea ice, one of the most sensitive climate bellwethers. I hope to do his memory some small measure of justice.
The current situation and some comments can be found after the jump.
Northern Hemisphere Sea ice as of 19 June
Since my last diary on 6 June, Northern Hemisphere sea ice extent briefly dropped slightly below the record ice melt season of 2006-07 in early June before slowing last weekend. Now sea ice extent is once again decreasing rapidly, at a pace paralleling (but about 2-4 days behind) the 2007 pace. The melt season to date compared to the record melt season and the 1979-2000 mean is shown below:
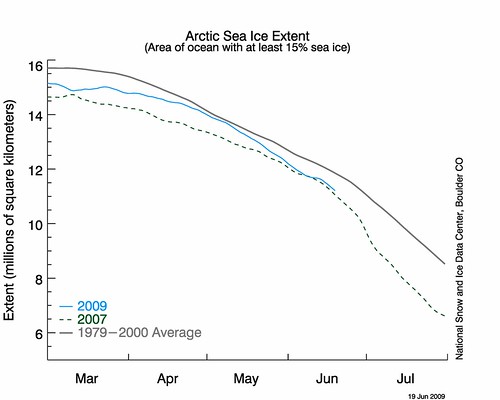
The decline in sea ice was most dramatic in 2007 from late June through early July; almost a vertical line. How 2009 tracks (or not) that period will be a significant (but not defining) indicator for the season as a whole.
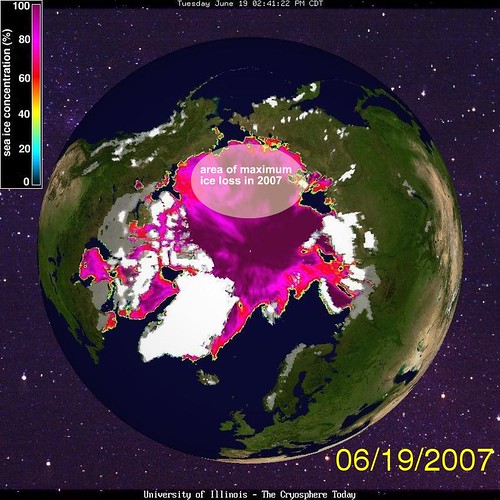
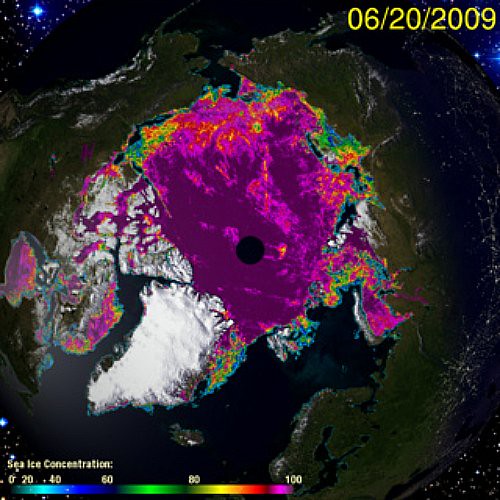
The map of sea ice concentrations appears below, with a comparison to the 2007 melt period on approximately the same date (courtesy of the University of Illinois Arctic Climate Change web page. The colors on the two maps don't match up, unfortunately (e.g. red color is 60% concentration in 2007 while dark blue is 60% in 2009 graphic), the resolution in 2007 graphic is coarser, and the one from this year is from one day later than last year, but you can get the idea.
There is considerably less ice in the Davis Strait (between Greenland and the Canadian Arctic islands) and east of Greenland now than in 2007. Less ice was north of parts of Siberia in 2007 than there is presently.
Discussion
The University of Illinois not only tracks total sea ice extent over the full Northern Hemisphere, but breaks it down by sections. Fourteen (14) areas are tracked this way. Of the 14, only 3 were near to slightly above normal. The worst off area was the region around Greenland (about 2/3 below normal), but several more were 33% or more below normal as well.
As always, future melt this season will depend on large scale circulation anomalies that affect air temperature, the amount of sunlight reaching the ice and open water, and ice drift. The main reason ice cover is so much more sensitive now than it used to be is because of reduction of ice thickness (and thus ice volume) that results from a warming climate. The same amount of surface area requires less heat to melt than before.
There also is the risk that older ice will be pushed out of the Arctic Basin by near-surface winds. This happened with 2 year old ice this past winter as can be seen in this animation here; this ice could have served as a base for rebuilding of more resilient sea ice, but is now melting or already melted southeast of Greenland.
I'll be keeping tabs on the melt season as it progresses. Probably another diary on this and related subjects will be forthcoming in a couple of weeks.
EDIT: A good discussion of the amount of ice volume loss can be found here, though it's a little dated and things have gotten worse since. The upshot is that mean ice thickness has dropped probably about 1-2 meters or more in the last 50 years, or about 25-50%.