Talking to sapelcovits the other week, I realized that I've mostly written about places very far from where I've ever lived. I wanted to write, instead, about my home area of Fairfield County, Connecticut, and its surprising demographic and political diversity. I have to break it up into a series, but this entry will have some introductory analysis of the county as a whole, followed by close looks at Greenwich, Darien, Norwalk, Westport, and Fairfield. I've included precinct-level analysis of statewide elections, State House districts, and the most satisfying "cracking" of a town in American history, along with my own impressions as, for once, a local.
Introduction:
My goal in this diary is to demonstrate that my home region--technically I was born in Westchester County, but I moved to Fairfeld County at a young age--has a lot more economic, ethnic, and political diversity than you might expect. The image of Fairfield County is rich investment bankers--all WASPs or Jews--living in McMansions. And, well, there are more than a few people like that. But the county as a whole is much more complicated.
Fairfield County is certainly among the wealthier areas in the country. But far from being uniformly so, the Bridgeport-Stamford metro area (coterminous with Fairfield County) actually has the single highest high-to-low wage ratio of any of the 100 largest metro areas, according to the Brookings Institute. Admittedly, it does also have the eighth-best wages at the lowest decile.
As for racial diversity, according to Wikipedia,
In 2010, 66.2% of Fairfield County's population was non-Hispanic whites and 10.8% of the population was black. Asians were 4.6% of the population. Latinos now constituted 16.9% of the population.[20]
I previously
found that this made Fairfield County one of the closest matches of any county to the racial makeup of the U.S. as a whole. To be sure, there are plenty of extremely white areas--but vast swaths of the country are far whiter. The ACS says that 27.4% of the county's population that's lived there at least five years speak a language other than English at home, with 13.7% speaking Spanish, and they also say that 20.1% of the county's population is foreign-born.
As for the "WASP" stereotype, Wiki says that "In 2000, the largest denominational groups were Catholics (with 433,832 members) and Mainline Protestants (with 95,244 members).[22] The largest religious bodies were The Catholic Church (with 433,832 adherents) and Judaism (with 38,800 adherents)[22]". According to the ACS' 5-year estimates, 18.1% of Fairfield County identifies their ancestry as "Italian", 15.9% identify as "Irish", 9.8% identify as "German", and only 8.7% identify as "English". Assuming that's correct, and that there isn't much minority overlap, about half of the non-Hispanic white population in Fairfield County identifies their ancestry as Italian or Irish. (This completely tracks with my experience, by the way, although since my own family is half-Italian, it might not be representative.)
Still, while there is a great deal of diversity, and while this diversity intersects with partisan politics in complicated ways, there are still some simple patterns.
Connecticut has 151 State House seats, each of which should have about 23,670 people. The American Community Survey (ACS) includes estimates of the demographic and economic information for all current state legislative seats.
When I sorted the 40 or so State House seats completely or partially in Fairfield County by estimated Median Household Income (MHI), and added which party currently holds the seat, I noticed something pretty remarkable:
Democrats currently hold every seat with a MHI below $70,000, and Republicans currently hold all but four seats with a MHI above it. As we'll see, this is partly a consequence of the 2010 elections, but even so, I think it's very interesting. Knowing only the MHI, you can predict a State House seat's current partisan representation with 90% accuracy! (I'll include the full table at the end of this diary.)
What's even more interesting is that there's supposed to be something the matter with Connecticut--income isn't supposed to be correlated with partisan affiliation, unlike in most states. Either that only holds higher up the ballot, or 2010 was different, or it only holds across the entire state, or the small sizes of the districts isn't preventing some kind of geographic fallacy problem.
Still, I'm going to take an even more granular look, where possible, hopefully over a few diaries (since this one only covers a few towns, and it's already quite long). I can't find precinct-level election returns for every city or town in the state. In particular, I can't find any for Stamford, Bridgeport, or Danbury, which is quite annoying. But where I could find the relevant information, I've color-coded the precincts based on who they backed in the 2008 Presidential race and 2010 Gubernatorial and Senate races.
Since Barack Obama did better than Richard Blumenthal, who did better than Dan Malloy, this should allow for a reasonable stratification of the area's precincts.
"Red" precincts voted for McCain, Linda McMahon, and Tom Foley. These areas are probably solidly Republican.
"Green" precincts went Obama/McMahon/Foley. These areas are probably a mix of genuine swing regions and regions where Obama over-performed.
"Cornflower/light blue" precincts voted Obama/Blumenthal/Foley. These are probably Democratically-leaning, but not safely Democratic, areas.
"Dark blue" precincts voted for all three Democrats, and are probably safely Democratic in most reasonably contested races, although many might have voted for Shays in 2008 or earlier, or for a Republican state legislator.
In fact, since Blumenthal got 55.16% of the vote, and won by about 12 points, his performance should be something close to the baseline (maybe a little worse) in D+7 Connecticut. So green and red precincts are probably generally Republican, and light and dark blue precincts are probably generally Democratic.
Note: I don't know how to account for absentee ballots, although some towns did it for me, and some towns didn't. I tried to account for them when they were broken down by district.
Greenwich:

The town:
Let's start with the same town you'd start with if you were driving up I-95: with Greenwich. Greenwich has a population of 61,171 people, making it easily the largest pure "Gold Coast" town, and I think it's basically the archetype. Still, as my father often says, Greenwich is more diverse than you might think.
The variable population density is suggested by the fact that the "blue" and "red" precincts in the above map have roughly equal populations (each a small fraction of the town--it's mostly "green").
As for ethnic diversity, here is a zoomed-in map, using DRA's "color by non-white" tool:
Yes, Virginia, there are minorities in Greenwich. I found this NYT article from 2007 on Greenwich's increasing diversity, and the consequences for the schools:
The superintendent, Betty J. Sternberg, has convened a 44-person task force to tackle the problem, bluntly declaring, “Our schools are becoming more segregated.”
“There will always be people who love their neighborhood schools, and that’s fine,” Dr. Sternberg told teachers last month at the Old Greenwich School. But, she said, “we’re getting to be an increasingly segregated town,” adding that she hoped residents, even without pressure from the state, would “embrace the value of being educated in a diverse setting.”
Though Greenwich’s population of 61,000 is 90 percent white, according to the census, nearly a quarter of the public school system’s 8,800 students are black, Hispanic or Asian. Yet their representation in many elementary and middle schools is lopsided.
At the Old Greenwich School, in a neighborhood on the east side of town near Stamford where modest fixer-uppers can fetch $1 million, school officials say the student body is roughly 95 percent white. On the west side of town near Port Chester, N.Y., an increasingly Hispanic area where there is a large housing project, the Hamilton Avenue School is 59 percent minority and the New Lebanon School is 53 percent minority, according to district officials; both are in violation of state law by being more than 25 percentage points off the district average in terms of racial mix. (Old Greenwich, meanwhile, is likely to be found in “impending” violation for deviating from the state average by at least 15 points.)
Technically, I'm guessing it was always a segregated town, and it's just getting to be a segregated town that isn't
all-white.
Wiki tells me that Greenwich has a number of different neighborhoods:
Greenwich has one local government but consists of several distinct sections, some of which have their own mailing addresses and ZIP codes: as Cos Cob 06807, Riverside 06878, Old Greenwich 06870, Glenville 06831 and Greenwich 06830 (sometimes referred to as Greenwich proper, central, or downtown Greenwich).
Indeed, the ACS doesn't seem to have unified information on Greenwich itself! The distinctions there mostly aren't relevant to our purposes, however.
The politics:
As I said, most of Greenwich is "green"--voting for Obama, but otherwise voting for McMahon and Foley. (Foley was a Greenwich resident, I think, and remarkably enough, so were McMahon, Blumenthal, and Himes.) In fact, Greenwich easily backed the entire Republican ticket in 2010. (One tiny precinct was actually a tie between Obama and McCain! 46 votes each, with 37 votes to "other". I colored it green.) My guess is that Obama somewhat over-performed in Greenwich, although few "green" precincts backed him by significantly more than his national numbers. Obama got 53.4% of the vote in Greenwich, but I don't think it's exactly a swing area in general.
Only four precincts backed Blumenthal, as far as I can tell, and they all backed Malloy as well--1A, 1B, 3, 4 are the four "blue" precincts. This is almost, but not quite, coterminous with the "nonwhite snake" visible in the above map. (1A is quite white, while 1 isn't, but went Republican in 2010. This might be a turnout issue, since 1 was actually stronger for Obama than 1A. Absentee ballots might have had something to do with it too.) "Blue Greenwich" has only 9,440 people, but it's only 64.2% white, and quite dense.
Meanwhile, the only precincts to back McCain are in what I've heard described as "back country" Greenwich. The NYT, in 1995, said this area is "[r]enowned as one of America's most prestigious addresses, [although] the back country of this Connecticut Gold Coast community is not for everyone who is rich. Families of highly placed executives who traditionally shun publicity gravitate to its silent woods and quiet, winding roads..."
"Red Greenwich" has only 9,790 people, and they're quite sparsely dispersed, it seems. All of the McCain precincts are in State House District 149, which the above table shows to be significantly wealthier than the other State House seats in Greenwich, 150 and 151.
The State House seats:

I'll save a further discussion of State House District 149 for when we get to Stamford (hopefully in a future diary).
District 150 is represented by a Republican, Lile Gibbons. It gave Obama a surprisingly robust 56.9% of the vote, and it's 75.3% white, 2.8% black, 13.9% Hispanic, and 5.8% Asian. (DRA is a bit inconsistent here, so I went with the state map.) Despite this, Gibbons doesn't appear to be in any danger--she went unopposed in 2008 and 2010. With a MHI of $121,482, it's the least affluent district in Greenwich (yeah, I know how ridiculous that is).
District 151 is also Republican, obviously, represented by Republican Fred Camillo. It gave Obama 53.1% of the vote, and it's 81.6% white, 1.5% black, 7% Hispanic, and 7.9% Asian. (Which is a pretty high Asian percentage.) I doubt it's voted for too many other Democrats.
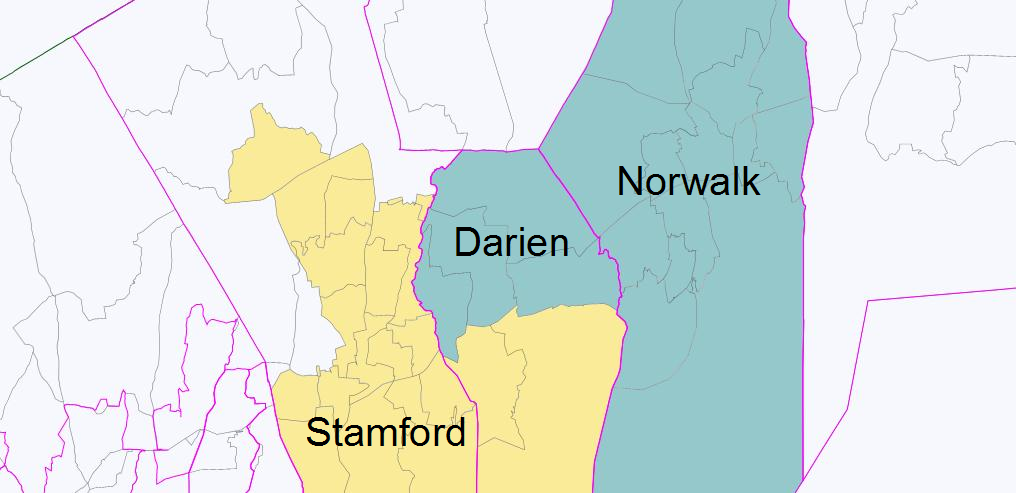
Darien:

The town:
Continuing up I-95, but skipping Stamford for now, we get to Darien. Darien is quite a town. In a recent interview, Chris Shays referred to it as "the center of my district". If there were any justice in the world, this would be a Macaca-level gaffe. Darien is wildly unrepresentative of Fairfield County and of CT-04.
It is perhaps one of the wealthiest decent-sized towns in the entire country, with the ACS' 5-year average giving it a Median Household Income of $175,766. (Note: The link goes by "Mean Household Income".) 20.9% of the population identifies their ancestry as "English"--a rate twice that of the county as a whole--although 27.1% identify as "Italian", 18.8% identify as "Irish", and 17.2% identify as "German". Only 9.3% of the population is foreign-born.
Some mixture of a local rivalry and my deeply-held values might color this section. I can't say too much from a personal perspective, since I've never been there. Not that I could have been from there, really. Darien has a notorious history as a "sundown town – a town which forbade African Americans to remain overnight via unwritten rules". It was also, as Wikipedia continues, the basis for the Oscar-winning film "Gentleman's Agreement", about towns that refused to sell to Jewish people.
An agreement that a local realtor, as recently as 2009, was, um, compelled to speculate might still be in effect! One comment to that post might be a minor classic of unconvincing denials:
There have been plenty of people in Darien of Jewish background just not in the fore front as is the same for Italians in Darien. Yes you are correct that there are no synagogues and if you noticed only 2 Catholic churches. Growing up in Darien it never seemed to bother me and I spent oodles of time at Ox Ridge and in the immediate area of that house that just sold. I wouldn’t call Darien anti-semitic but I would say that very few people in Darien on the whole ever speak of their ethnic background.
All right, one more astonishing Darien quote. Here's the
Greenwich superintendent from the earlier article:
“If you live in Darien, none of this applies to you,” Dr. Sternberg said. “It will never apply to them.”
The politics:
Unsurprisingly (let's be honest), Darien is staunchly Republican. That's something of an understatement. It gave McCain 54.2% of the vote, but when Richard Blumenthal was carrying the state by over 3-1 in 2006, he managed to win Darien...by 500 votes. In that same election, Susan Bysiewicz lost Darien easily, even as she was winning the state by a similarly massive margin.
McCain carried every precinct in Darien, but there's a certain amount of regional variation. He only narrowly carried Darien's District 3 (on the Stamford border), and that's also the only precinct that Dan Malloy lost by less than a 2-1 margin. I cannot believe that Obama almost won a precinct in Darien. Do you think they'd have seceded?
The State Senate districts:
Because of the odd layout of Fairfield County's Senate districts, and because of how I'm breaking up these diaries, I can't look at too many State Senate districts, but I can't help but include these two.
You see, unfortunately for Darien, but fortunately for the state of Connecticut, it doesn't have anywhere near enough people to anchor a State Senate district, and it's in between two of the district's urban enclaves. As a result, both the old and new Senate maps have perhaps my favorite gerrymander of all time:
Aaah, that's the stuff--straight out of an abgin diary, but it's the actual districts! How's it feel to be the geographically-concentrated ones, Republicans? The "Stamford" district on the left is a 64.8% Obama district that's 49.9% white, 14.1% black, 26% Hispanic, and 8% Asian. The "Norwalk" district on the right is a 62.1% Obama district that's 60.7% white, 11.6% black, 21.3% Hispanic, and 4.6% Asian.
Sorry, Darien. Next time y'all try white flight, maybe fly a little farther away? (Those are the new districts--I've drawn the current district lines elsewhere in this diary, but it's pretty much the same here.)
Norwalk:
The town:
Continuing up I-95, we reach Norwalk. Norwalk doesn't get the attention it deserves. It has one of my favorite movie theaters, the Garden Cinemas, as well as a surprisingly urban nightlife scene in South Norwalk ("SoNo"). According to DRA, Norwalk is 55.7% white, 13.4% black, 24.3% Hispanic, and 4.8% Asian, making it another of Fairfield County's minority enclaves. It has somewhat more of a "working-class" feeling than the surrounding area, although nearly anywhere looks blue-collar next to Darien, New Canaan, and Westport. The ACS gives the Median Household Income as $76,161.
The politics:
As I said, Norwalk, which gave Obama 65.5% of the vote, doesn't get the attention it deserves. A lot of people think that Bridgeport was the only town to vote for Jim Himes in 2008. (Even I thought so, until I looked it up.) Not so! Norwalk did the same. In fact, Himes carried nearly every precinct in Norwalk, except for 141A, even in 2008. Blumenthal did the same in 2010. Malloy, meanwhile, lost 141A, along with 142B and 143B.
In the 2006 Democratic primary, Lamont beat Lieberman in nearly every precinct in Norwalk. The two precincts Lieberman carried are an odd pair--the light blue 143B over on the Westport border, and the dense, 36.2% white 140A bordering the other light blue precinct.
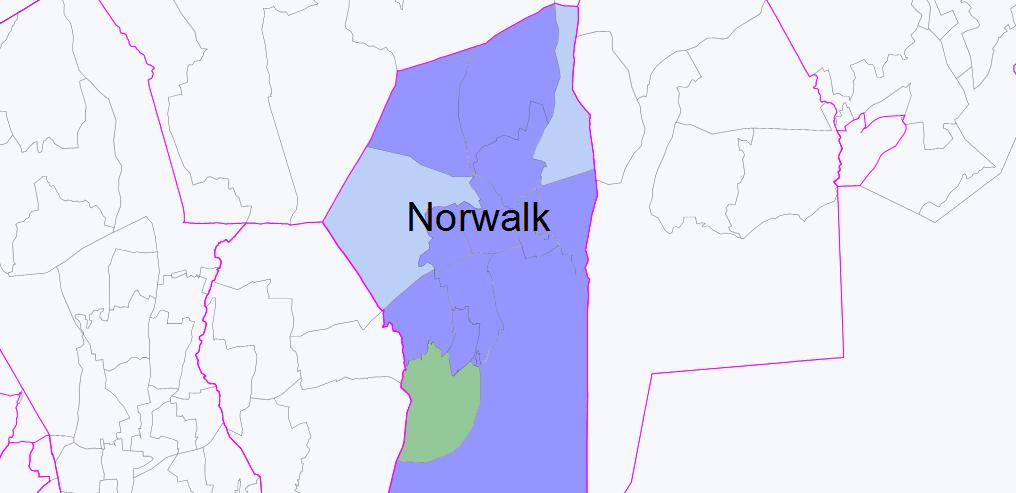
Interestingly, Precinct 141 gave Obama 60.5% of the vote--more than many Obama/McMahon precincts. It is also by far the whitest Precinct in the city at 94.7% white. Unsurprisingly, it might be somewhat autonomous from Norwalk as a whole--it's largely coterminous with Rowayton, where, "[a]ccording to Forbes magazine, the 2010 median home sale price was $1,674,964, counting Rowayton among the most expensive communities in Connecticut as well as the nation". As Wiki points out, Rowayton has its own stop on Metro North.
The State House districts:
Rowayton--wealthy, white, and with its own Metro stop--is, unsurprisingly, in Darien's State House district, District 141:
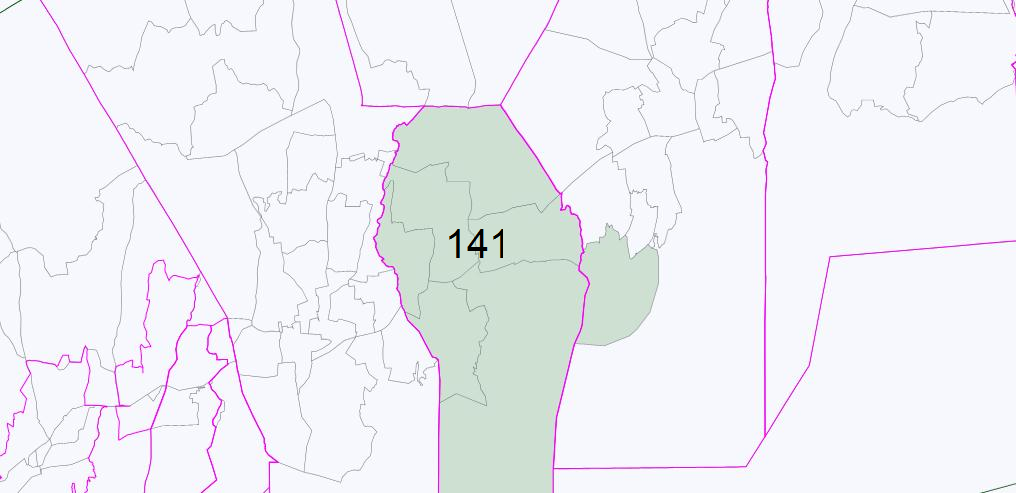
With a MHI of $164,146, District 141 is perhaps the wealthiest state legislative district in the state, and (going off an old "Social Explorer" analysis I tried) it might even be the wealthiest state legislative district in the nation. It's represented by Republican Terrie Wood. Thanks to Rowayton, it gave McCain a mere 51.5% of the vote.
Most of Norwalk, though, is contained in the three Assembly districts entirely within city limits.
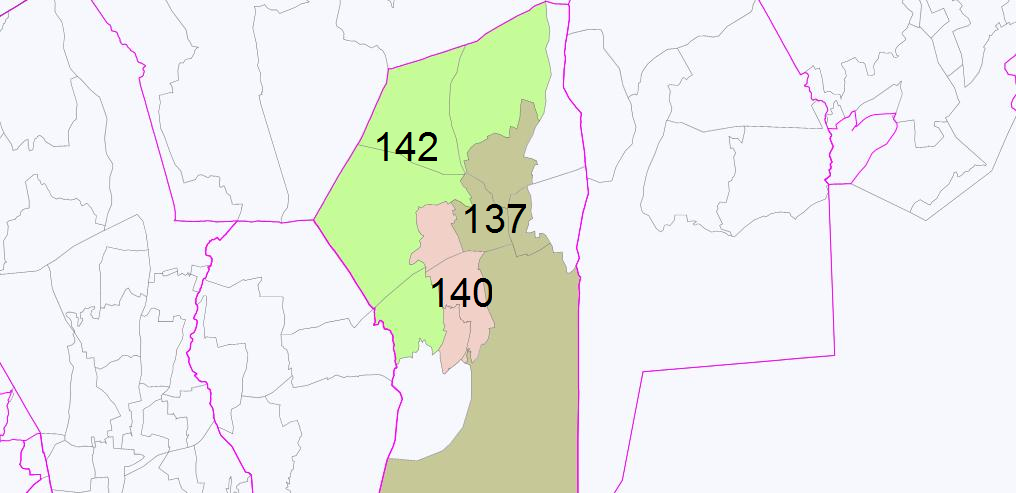
District 142, running along the city's outskirts, is represented by Republican Larry Cafero. It gave Obama 58.8% of the vote, and, according to the ACS, it's fairly heavily Italian and Irish. It's no working-class bastion, though--the ACS has the MHI as $97,336, and it has 52.2% of the workforce in "Management, business, science, and arts occupations".
District 140, on the other hand, is 25.6% white, 25.7% black, and 42.9% Hispanic. The ACS has the MHI as $55,742. It's represented by a Democrat, Bruce Morris, shockingly enough. It's an 80% Obama district.
District 137 is somewhere in between. It includes Norwalk Harbor, and is 55.2% white, 12.6% black, and 24.7% Hispanic. The ACS has about 2/3 of the workforce working in "Management, business, science, and arts occupations" or in "Sales and office occupations", and has the MHI as $67,270. Judging by Google maps, it has much of Norwalk's densest and most "urban" area. It's represented by Democrat Chris Perone. It gave Obama 68.1% of the vote.
Westport:
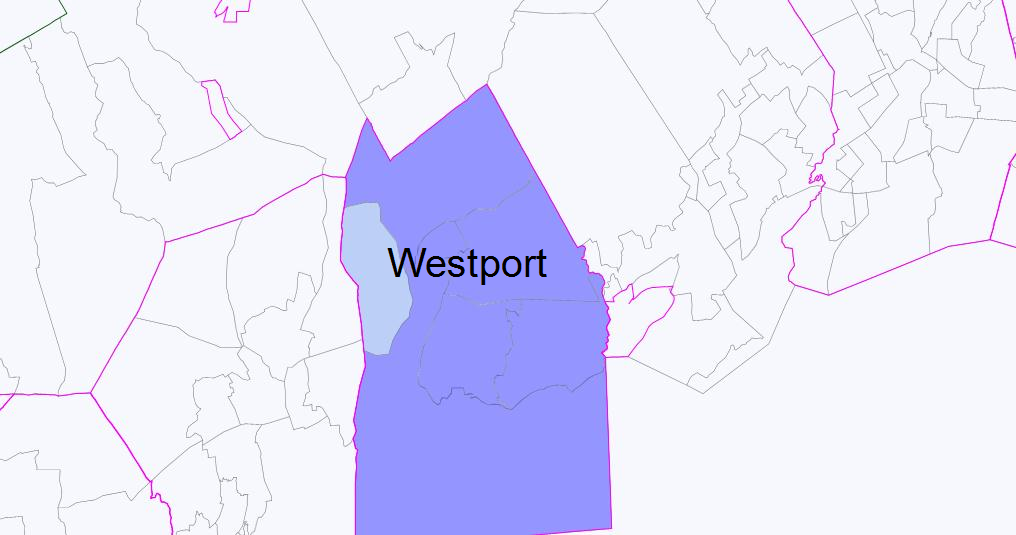
The town:
Westport! My hometown, and, politically, the Superman to Darien's Bizarro. Forgive me if I describe it at length.
It's an unusual place. Some of the older residents have occupations and affects fitting the rambling small town it used to be. But even over my lifetime, it's gotten more and more upscale--over the past few years, it's become one of a very few municipalities to have both a Tiffany's and a Steinway Piano Gallery. In a similar vein, my high school used to be an odd, ramshackle building consisting of a bunch of low buildings--formerly separate--connected by long, rambling hallways. It was torn down around the time I graduated, and rebuilt at exorbitant cost (even for Westport) into the kind of high school you might see on an ABC Family Series. Incidentally, my high school newspaper gave the number of students attending Ivy League schools--20, I think, out of a class of about 260 or 270--as well as the number of students who applied.
Westport has a long history in the arts. Stephen Sondheim apprenticed at the Westport Country Playhouse when he was 20. And, most famously, Hollywood legends--and liberal stalwarts--Paul Newman and Joanne Woodward lived here for decades. Wiki also reminds me--as if I should have needed it--that Martha Stewart shot her first show in Westport for some time, although eventually she moved away, publicly complaining that we had lost our small town charms. Other notables who have (or recently had) at least one house there include Don Imus, Harvey Weinstein, Linda Fiorentino, and Phil Donahue and Marlo Thomas.
Westport also has a notable Jewish population--indeed, Norwalk and Westport have their own entry at the Jewish Virtual Library. Exact population estimates are hard to come by, but the Jewish Databank gives a 2001 estimate of 5,000 for the town. The full report elaborates:
Almost one in five persons in both Westport and Weston are Jewish, compared to 9% in Wilton
and only 4% in Norwalk.
In Westport, a total of 5,814 persons live in 1,975 Jewish households. 14% of persons in Jewish
households are not Jewish. Thus, there are 4,983 Jews in Westport (Table 3-1).
In 2000, Westport's population
was 26,644, meaning that about 22% of the town lived in Jewish households.
According to the ACS, only 12.3% of the population identifies their ancestry as "English" (still somewhat more than the county as a whole) compared to 9.6% identifying their ancestry as "Russian" (nearly three times as much as in the county as a whole).
The politics:
Despite my parochialism, Westport really is worth studying closely. Perhaps along with nearby Weston and Redding, it might be the greatest anomaly in Fairfield County, or even one of the greatest anomalies in American politics. It's 89.9% white, it has a MHI of $150,771, it might be one of the most affluent decent-sized municipalities in the country, it's suburban/exurban in character--and it gave Obama 65.1% of the vote. (My sense is that similar areas like the Bay Area or the D.C. suburbs are somewhat more urbanized, but I don't know if that's actually true. I had an argument about it with sapelcovits yesterday.) I'm certain that the town's Jewish population has something to do with this, but I don't know if it's liberal because it's Jewish, or if it's Jewish because it's liberal. Ain't like they could've moved to Darien.
Obama easily won every precinct in the town. Richard Blumenthal won every precinct as well, although some of them were closer. Following that same link, Dan Malloy only failed to win a single precinct, 136-5, covering the King's Highway neighborhood, which is across the Saugatuck from most of the town. (The next-most-Republican precinct is probably 133-1, in the town's southeast, which a few statewide candidates lost, or lost as well.)
Westport Democrats, including me and my father, natch, backed Ned Lamont over Joe Lieberman in every precinct in the 2006 Democratic primary, much to the consternation of Lieberman supporter, and occasional Westport mansion dweller, Don Imus. Unfortunately, the bastard managed to win every precinct in the general election.
The State House districts:
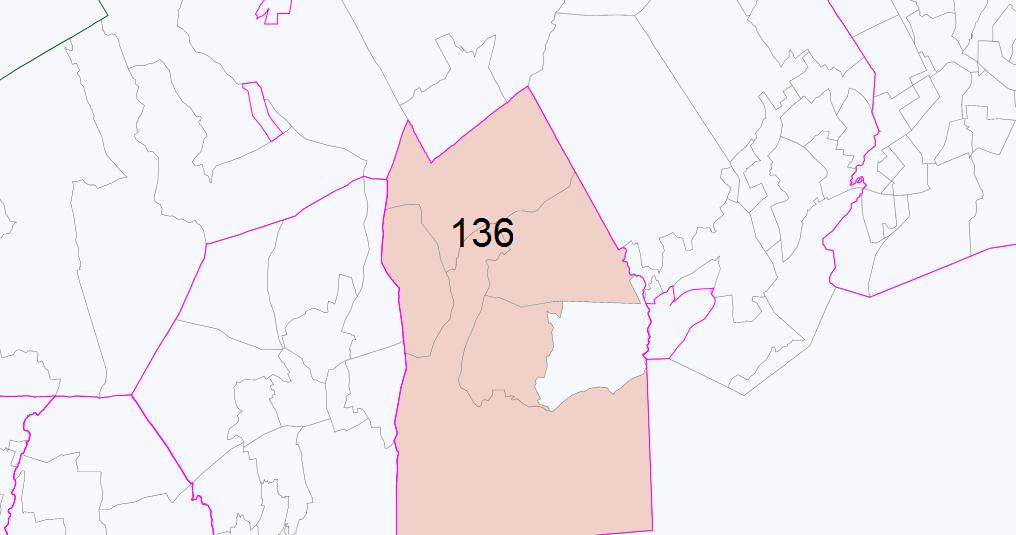
Most of Westport is coterminous with House District 136, represented by Democrat Jonathan Steinberg. (The boundaries changed very slightly during redistricting, eliminating precinct 133-1 instead of precinct 136-5. Note that those are perhaps the most Republican precincts in the town.) The ACS gives the MHI of the current District 136 as $151,238. Again, this is perhaps the biggest anomaly Fairfield the County--that's nearly twice the "cutoff" that separates every Republican district from nearly every Democratic district. Going off that same old "Social Explorer" project, District 136 might actually be the wealthiest state legislative district in the entire country to be represented by a Democrat. It gave Obama 65.2% of the vote.
Fairfield:
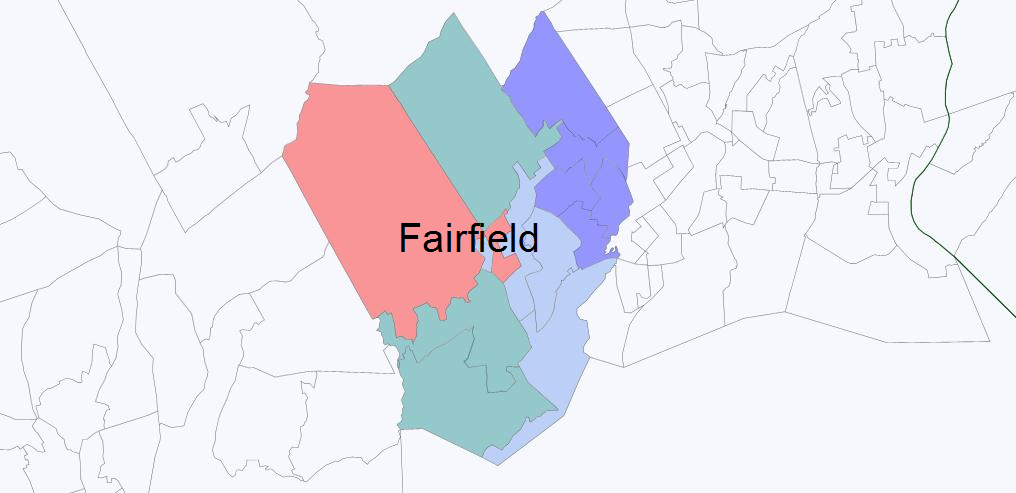
The town:
Fairfield, where my mother lived until recently, is in between Westport and Bridgeport, and not just geographically. I wouldn't say it has an urban feel, but it's quite a bit more commercial and livelier than Westport, with more stores, more bars and restaurants, a movie theater, and so on. (If you're in Westport, and you want to go out, you'll probably end up in Fairfield.) The demographics reflect this: It has 59,404 people, according to DRA, and it's 88% white, 1.7% black, 5% Hispanic, and 3.7% Asian.
The politics:
Fairfield, which gave Obama 56.4% of the vote, is among the more swingy and heavily-contested towns we've seen so far. Overall, the town went for Foley, Blumenthal, and Himes--the latter by perhaps a single vote!--in 2010.
As you can see, it has every kind of precinct: McCain precincts, Obama/Foley/McMahon precincts, Obama/Foley/Blumenthal precincts, and Malloy precincts. There's a pretty clear regional divide here.
The McCain precincts--3-133 and 4-134--are in "back country" Fairfield, as is one of the "green" Obama/Republican precincts, 2-134. It's evident even on Google maps that this area is the least dense and "urban" part of town. The big McCain precinct, 3-133, contains the entirety of "Greenfield Hill, with its large areas, famous dogwood trees, and picturesque green with its white-spired Congregational church." Of the other "green" precincts, 1-132 covers ritzy Southport and 9-133 has some of the area in between, including some of downtown (the Metro North stop, notably). I originally had 9-133 as a "light blue" precinct, but the fact that it's only 55.7% Obama should have warned me.
Meanwhile, the "light blue" precincts cover some more of downtown Fairfield, Fairfield University, the beach, and much of the densest and most "urban" parts of town. Notably, all of the "dark blue" Malloy precincts--likely the most Democratic precincts--are near the Bridgeport border, although they don't seem to be particularly nonwhite. Himes seems to have won all the dark blue precincts and light blue precincts against Debicella, with Debicella winning the red and green precincts. In 2004, there was apparently the same breakdown as Blumenthal/McMahon, with the red and green precincts going for Bush and the light and dark blue precincts going for Kerry.
(In 2006, Lieberman seems to have won the "blue" precincts 6 and 7, and lost or tied everywhere else, although the precincts aren't broken up the same way, and I'm not sure how absentee ballots are broken down in these two older elections.)
The State House districts:
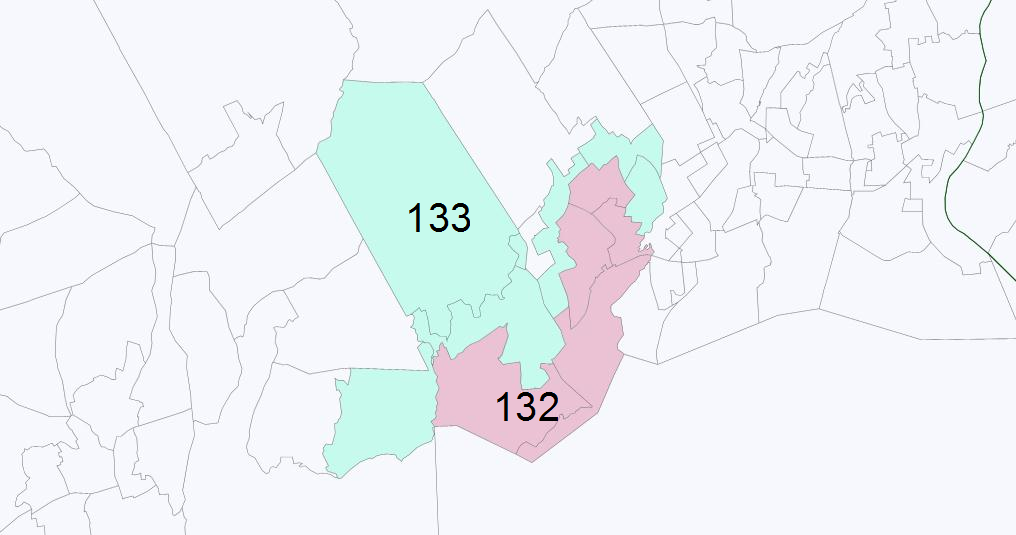
Much of Fairfield is in Districts 132 and 133. District 133 currently includes the "leftover" precinct in Westport, one of the "back country" McCain precincts, some of downtown, the Metro stop, Fairfield University, and then snakes its way to the Bridgeport border. I don't know what the hell that's about. It went 56.4% for Obama. It's going to change some in redistricting, pulling out of Westport and the McCain precinct and taking on Southport.
As is, thought, District 133 is one of the four "anomaly districts", as it's represented by a Democrat, Kim Fawcett, despite a MHI of $133,574. Even in 2010, Fawcett lost the McCain precinct, but carried the other three in Fairfield.
District 132, which includes Fairfield's entire coast, went 58.3% for Obama. With a MHI of $99,032, it used to be an anomaly, perhaps, but in 2010, Democratic incumbent Thomas Drew lost--by like 13 votes!--to Republican challenger, and current incumbent, Brenda Kupchick. As far as I can tell from the above-linked 2010 results, Kupchick lost every single precinct other than the sole "green" precinct in her district, Precinct 1--Southport. It won't be in the new district, although some of the other precincts were extremely narrow.
Appendix:
Here's the MHI and current partisan representation of Fairfield County's State House seats:
R State House District 141 (2010), Connecticut $164,146.00
R State House District 135 (2010), Connecticut $164,028.00
R State House District 125 (2010), Connecticut $158,190.00
D State House District 136 (2010), Connecticut $151,238.00
R State House District 149 (2010), Connecticut $148,607.00
D State House District 147 (2010), Connecticut $134,430.00
D State House District 133 (2010), Connecticut $133,574.00
R State House District 111 (2010), Connecticut $132,907.00
R State House District 151 (2010), Connecticut $132,791.00
R State House District 150 (2010), Connecticut $121,482.00
R State House District 143 (2010), Connecticut $117,083.00
R State House District 112 (2010), Connecticut $109,784.00
R State House District 123 (2010), Connecticut $108,537.00
D State House District 106 (2010), Connecticut $108,102.00
R State House District 134 (2010), Connecticut $107,008.00
R State House District 107 (2010), Connecticut $102,750.00
R State House District 132 (2010), Connecticut $99,032.00
R State House District 142 (2010), Connecticut $97,336.00
R State House District 108 (2010), Connecticut $93,310.00
R State House District 2 (2010), Connecticut $84,026.00
R State House District 122 (2010), Connecticut $83,309.00
R State House District 138 (2010), Connecticut $81,402.00
R State House District 144 (2010), Connecticut $80,747.00
R State House District 120 (2010), Connecticut $79,060.00
R State House District 113 (2010), Connecticut $78,457.00
D State House District 146 (2010), Connecticut $69,778.00
D State House District 109 (2010), Connecticut $69,219.00
D State House District 137 (2010), Connecticut $67,270.00
D State House District 148 (2010), Connecticut $63,582.00
D State House District 126 (2010), Connecticut $56,332.00
D State House District 140 (2010), Connecticut $55,742.00
D State House District 121 (2010), Connecticut $54,167.00
D State House District 127 (2010), Connecticut $53,910.00
D State House District 145 (2010), Connecticut $48,575.00
D State House District 110 (2010), Connecticut $44,971.00
D State House District 129 (2010), Connecticut $44,574.00
D State House District 124 (2010), Connecticut $34,076.00
D State House District 128 (2010), Connecticut $31,801.00
D State House District 130 (2010), Connecticut $25,233.00
