
Point 1: The Economic Ditch from Q4 2008 was mega-deep
First, it is important to note that the economic ditch that the Bush version of trickle-down tax cuts left us with was actually a whole lot deeper than most of us knew in 2009 when President Obama was planning the American Recovery and Reinvestment Act. (pdf link here). As excellently noted by John Perr here, experts vastly underestimated the economic downturn of the fourth quarter of 2008 and it wasn't until around August of 2011 that the true magnitude of that downturn became clear.
Perr's quote from The Economist explains just how much deeper that economic ditch was than we previously thought:
The White House looked at the economic situation, sized up Congress, and took its shot. Unfortunately, the situation was far more dire than anyone in the administration or in Congress supposed.
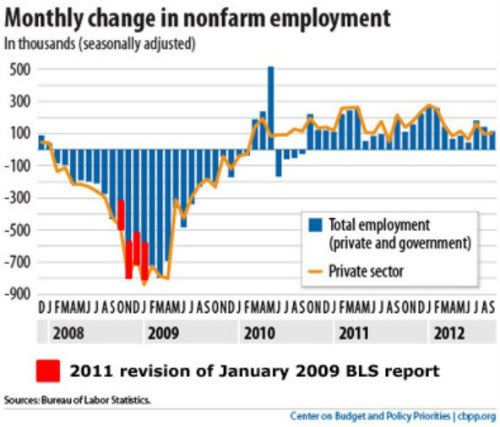
Output in the third and fourth quarters fell by 3.7% and 8.9%, respectively, not at 0.5% and 3.8% as believed at the time. Employment was also falling much faster than estimated. Some 820,000 jobs were lost in January, rather than the 598,000 then reported. In the three months prior to the passage of stimulus, the economy cut loose 2.2m workers, not 1.8m. In January, total employment was already 1m workers below the level shown in the official data.
Here is the graph Perr shared to show how much worse Q4 2008 was than previously thought:
Point 2: ARRA was designed for a smaller downturn
Based on the official numbers at the time, some of the best economists in the world estimated that the unemployment numbers would top out at around 9% even without a stimulus. They estimated that ARRA would keep the unemployment numbers below 8% and Christina Romer wrote a report with numerous caveats to explain their findings. (pdf of that report here) Only afterward did they begin to realize just how much worse the economy really was. (And yes, I know that Paul Krugman and others were telling them they needed a bigger stimulus. But none of them, including Krugman, had enough data to prove that point at the time.)
(Incidentally, President Obama seems to have made no promises about keeping unemployment below that 8% number. Despite what Mitt Romney, Eric Cantor and other serial liars have said. I could find no such promises and, for what it is worth, neither did Politifact.)
Point 3: Despite being designed for a smaller downturn, ARRA was very effective
When compared with the jobs creation numbers of previous presidents, the private sector grew faster in the first three years of the Obama administration than it did in three of the previous five administrations — the exception being Bill Clinton’s administrations, when private sector growth was more rapid. In both of George W. Bush’s terms as well as in the first three years of the George H. W. Bush administration, though, the private sector grew more slowly. (link)
One graph not included in Perr's diary is this one from the Center on Budget and Policy Priorities (link) showing the difference between the actual unemployment numbers and what they might have been under the best and worst scenarios without ARRA:
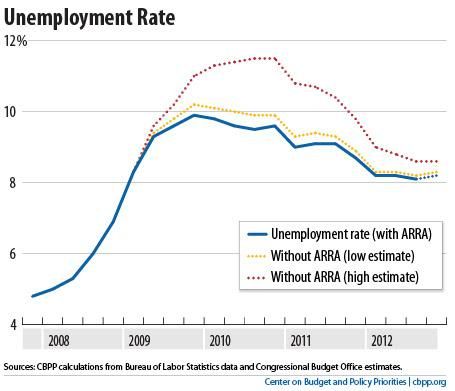
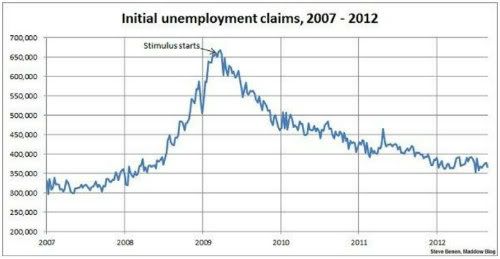
It is within the realm of possibility that the unemployment number would have gone up almost to 12% without ARRA. That's a big difference between what might have happened and what did happen with ARRA. But the almost immediate effect of ARRA on the number of initial unemployment claims is even more striking. Steve Benen at the Maddowblog has this graph showing the effect of the stimulus on initial unemployment claims:
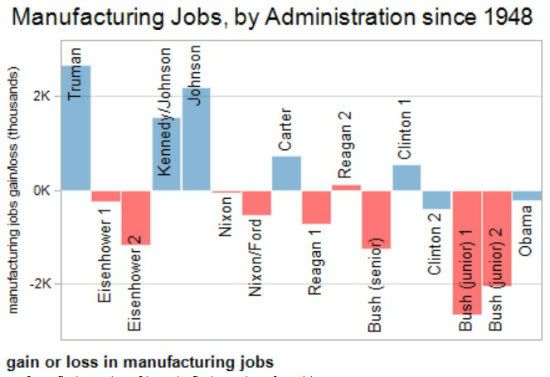
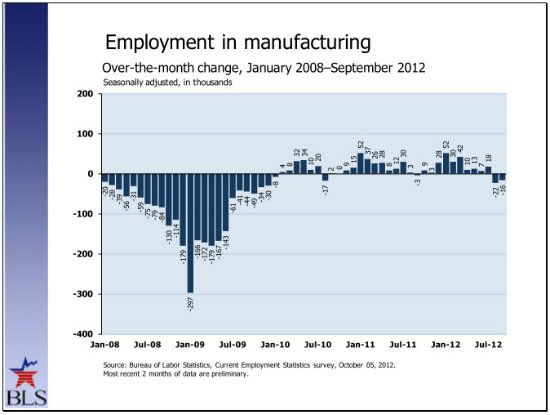
Alternet's response to President Clinton's convention speech included a systematic comparison between Democratic presidents and Republicans and found that President Obama's manufacturing growth is better than all but one of the last nine Republican Presidential terms. Of all nine Republican terms going back to Eisenhower, only Reagan's second term was better:
Based on all three of our measures, Obama’s manufacturing jobs record is currently better than eight of the nine Republican presidential terms. President Ronald Reagan’s second term does slightly better than Obama’s incomplete first term, but the numbers are close enough that this may change once we have all the numbers.
Here is their graph showing from first quarter of term to first quarter of next term(see all three graphs
here):
Here is the most recent BLS (pdf) graph of President Obama's manufacturing jobs numbers:
A CBO report detailing the continuing effects of ARRA is here (pdf format).
Point 4: The economy is slowing down, but not that much
According to the BLS September jobs report, in 2012 employment growth has averaged 146,000 per month, compared with an average monthly gain of 153,000 in 2011. The 2012 numbers improved recently with an upward revision for a total of 86,000 jobs to the July and August numbers (contained in the September jobs report) and a recent preliminary benchmark announcement of an additional 386,000 jobs for April 2011-March2012. These revisions provide a good context for the recent improvement in the unemployment number down to 7.8%.
There is some speculation (ie Ezra Klein and Kevin Drum), that BLS is non-intentionally but systematically undercounting jobs and has made the economy, or at least the unemployment number, look worse than it has actually been.
Point 5: Public sector job losses make unemployment higher than it should be
In May, Justin Lahart of the Wall Street Journal (and seconded by Barry Ritholtz) suggested that without government (ie public sector) job cuts, the unemployment number would have been 7.1%:
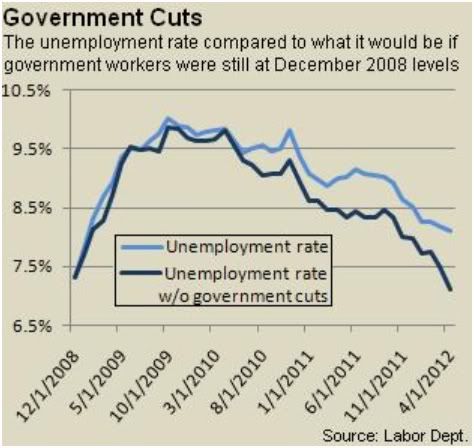
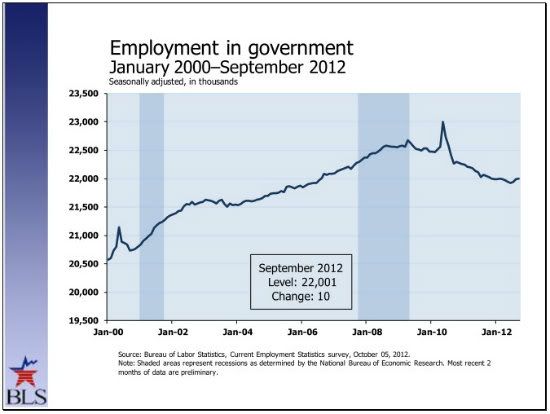
The main drag on the economy has been the public jobs sector. Public sector employment has made modest gains of 73,000 jobs over the last 3 months, with 10,000 of that coming in September. But since June 2009, there has been a net loss of 569,000 jobs. (pdf link) This is mostly due to cuts at the state and local levels, mainly in red states which Tea Party Republicans seized control of in 2010.
The current month's public sector graph is here:
One example of a state with a Republican governor making such public sector cuts is New Jersey. Recently, New Jersey Policy Perspective released a report (pdf) on how much public sector job loss was affecting the state's economy. Here is some of what the report said (link):
[I]f not for the loss of public-sector jobs, New Jersey’s 2011 unemployment rate would be more than a full percentage point lower: 8 percent instead of 9.3 percent. That rate would be even lower when accounting for the effect of public-sector job loss on private-sector employment.
......
Unlike the previous two recessions, public-sector jobs continued to be lost after the latest recession began. This is a marked change in strategy from earlier recessions, when public-sector jobs were maintained or added during and after the downturn to help the state to recover more quickly.
Among other things, the report calls for the federal government to "provide targeted financial assistance to state and local governments that meet specific criteria promoting efficiency in public services." President Obama has proposed the
American Jobs Act that would include money to do that very thing. Unfortunately, the legislation has been
blocked by the Obstructionist GOP congress.
New Jersey's problems are unfortunately all too common. Because of this pervasive issue,The Economic Policy Institute has recently suggested that aid to state and local governments should be the top priority for job creation.
Point 6: GOP obstructionism also hinders jobs creation
Paul Ryan and others met on the night of President Obama's inauguration and vowed to block him at every turn, be completely uncooperative and deny him any successes. (link) Without this obstruction, unemployment might easily have been below 6%.(link)
The main point here is that the President's American Jobs Act has been blocked by Republicans in congress. Recently we had the first anniversary of the original obstruction of this specific bill and Think Progress shared three estimates of the jobs AJA would create:
–Moody’s Analytics estimated the American Jobs Act would create 1.9 million jobs and add two percent to gross domestic product.
–The Economic Policy Institute estimated it would create 2.6 million jobs and protect an addition 1.6 million existing jobs.
–Macroeconomic Advisers predicted it would create 2.1 million jobs and boost GDP by 1.5 percent.
–Goldman Sachs estimated it would add 1.5 percent to GDP.
Of course that isn't all the Republicans are blocking. More on that
here.
Point 7:Democrats have historically had better economies
Democratic Presidents have better economies than Republicans. The reason Democrats have better economies is actually quite simple. Increased consumer demand is what creates jobs and leads to improvement in the economy. (link) Under Democrats, the middle class and the poor do better. And they spend the money that drives the economy. Larry Bartels, number 9 in the list below, has made a career of studying the gap between the haves and the have nots and points to the extra income of the poor and middle class as the main reason Democrats have better economies in an article here.
Here is President Clinton making this point about the middle class:
Republicans tend to give tax cuts and incentives to people who already have a lot of money and therefore don't spend as much of the extra income. Corporations and rich people are notorious hoarders when it comes to extra money.
President Obama has repeatedly said that government is not the solution to all of our problems but it is a solution to some of them. In the debate last Wednesday night Mitt Romney used what was probably supposed to be one of his "zingers" to say that trickle-down government is not working. Not only is "trickle-down government" working now, it has worked well in the past.
The most famous observer that Democratic presidents,the ones who Romney is accusing of using "trickle-down government" tactics, are better at jobs creation is President Clinton. Here he is making that case:
Bloomberg, Alternet, CBS, HuffPo (Bonnie Kavoussi), HuffPo (Colin Gordon), Addicting Info (Justin Acuff) and some guy named Ben Glaser checked out these claims and found them to be true. For what it's worth, Factcheck.org (in conjunction with USA Today) and Politifact also found these statements to be true.
Below are links to 27 different discussions by 24 different individuals with details and graphs, three of which are books, and one video. All of these discussions show that Democratic Presidents have better economies. The first person I ever saw quantify the data is Michael Kinsley, whose link is first in the list. I recommend starting there. I also recommend anything Rachel Maddow does, as in the number 11 video. You might prefer the three books at 2b, 6b or 9c. Take your pick:
1)Kinsley link; 2)Deitrick, Goldfarb link,2b) Bulls Bears and the Ballot Box: How the Performance of OUR Presidents Has Impacted YOUR Wallet; 3) Richard Carroll link, 3b) The President as Economist: Scoring Economic Performance from Harry Truman to Barack Obama; 4) Christopher Carroll link from the Japan Times; 5) JPMorgan; 6) Kevin Drum; 7) Larry Greenberg; 8) Ezra Klein; 9) Larry Bartels, 9b) pdf of Partisan Politics and the U.S. Income Distribution, 9c) Unequal Democracy: The Political Economy of the New Gilded Age; 10) h/t Curry Democrats.
11) Rachel Maddow:
The stock market is also better under Democrats(12). More on that here(13), here (14) and here (15). In addition to all this you can read what (16) Jon Perr, (17) Floyd Norris and (18) Alan Blinder have to say about how Democrats have better economies than Republicans. And if all that is not enough, you can find more (19) here, (20) here, (21) here, (22) here and (23)here.
(24)Paul Krugman discusses the work of Larry Bartels here.
