I've long been bullish on Democratic chances in Arizona, but the 2012 election saw Obama do surprisingly badly there, although Senate candidate Richard Carmona did surprisingly well (in part thanks to one of a number of strong Libertarian candidates in the state). Obama's 45.4% of the two-party vote was barely an improvement over John Kerry. I've computed 2012 Presidential results by legislative district, and the Arizona Independent Redistricting Commission has results from 2004 and 2008. Somewhat counter-intuitively, I think demographics and trends could actually be playing against Democrats right now, but let's see what you think.
Introduction:
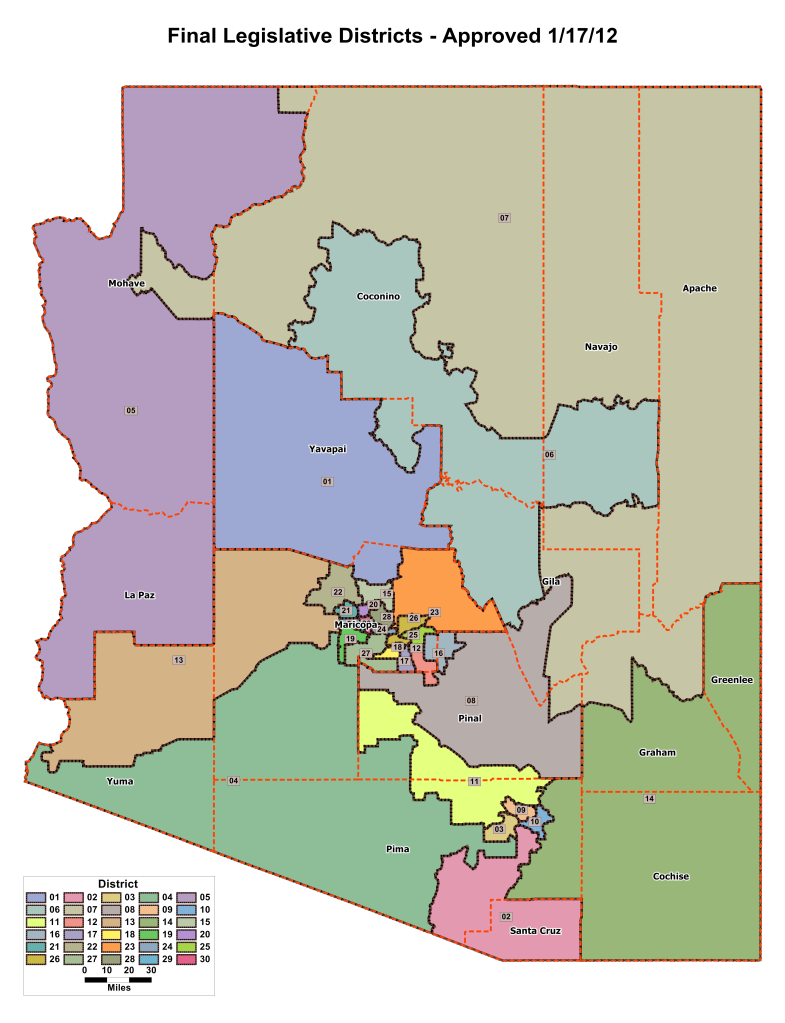
Above is a map of Arizona's 30 new legislative districts, taken from the Arizona Independent Redistricting Commission.
Obama carried 12 of these in 2012, and came close to carrying LD-18, with 49% of the two-party vote. Then he got 46% in LD-08, 45% in LD-28, 43% in LD-20, 43% in LD-06 and LD-17, and it goes downhill from there.
The AIRC also has John Kerry's 2004 results for each district. The advantage of comparing 2004 to 2012 is that it allows us to ignore the tricky 2008 election, where Obama faced Arizona favorite son John McCain. As it happens, Kerry and Obama won the same 12 districts.
Below is a scatterplot of Kerry's percentage (using the "tentative final" change report) vs. Obama's percentage in 2012. I used Obama's two-party share; I'm not sure what the AIRC did for Kerry, but that shouldn't matter too much.
For Obama's 2012 results, I used precinct-level results by county, courtesy of the Arizona Secretary of State's compilation, except in the case of Graham County, where I had to go to the county site. All of Arizona's votes seem to be allocated by precinct and totals match the certified canvass. The "riding names" are my own after various kinds of research, including looking at the Arizona Capitol Times, the names of Phoenix Urban Villages, and this guy's neighborhood map.
I think the AIRC accidentally switched the numbers in that "tentative final report" for LD-01 and LD-14, so I switched those back.
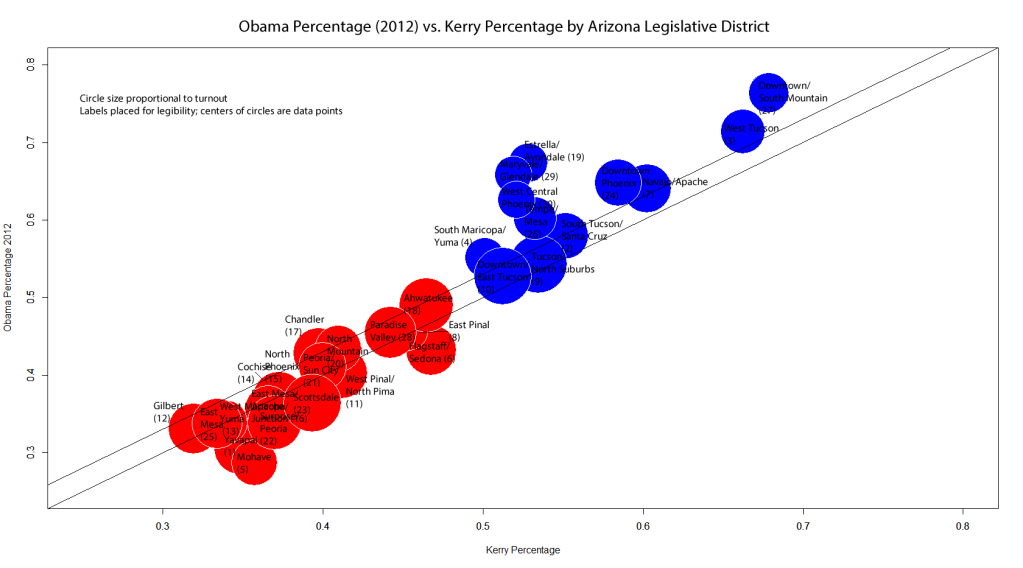
(I originally placed the text automatically using R, but I think this is a bit more legible, with the sacrifice that the labels aren't placed consistently.)
The size of the circle is proportional to the total number of votes cast for Obama and Romney in the district in 2012. The 12 blue circles are the 12 Kerry/Obama districts; the 18 red circles are the 18 Bush/Romney districts. The two diagonal lines represent Obama matching Kerry and Obama improving on Kerry by three points (which was more or less the national swing).
The overall correlation is quite high, with an r-squared of about 0.92.
As you can see, Obama galloped ahead of Kerry in LD-19, LD-29, and LD-30--all West Phoenix, and heavily Hispanic, districts.
But Obama stagnated or fell behind Kerry in rural districts likeLD-01, LD-05, and LD-06 (which is rural outside of Flagstaff and Sedona), as well as in some suburban Phoenix districts like LD-22 (Peoria/Sun City) and LD-23 (Scottsdale). And even LD-18--the great Democratic hope--didn't really "trend" blue relative the country.
Turnout and Swing:
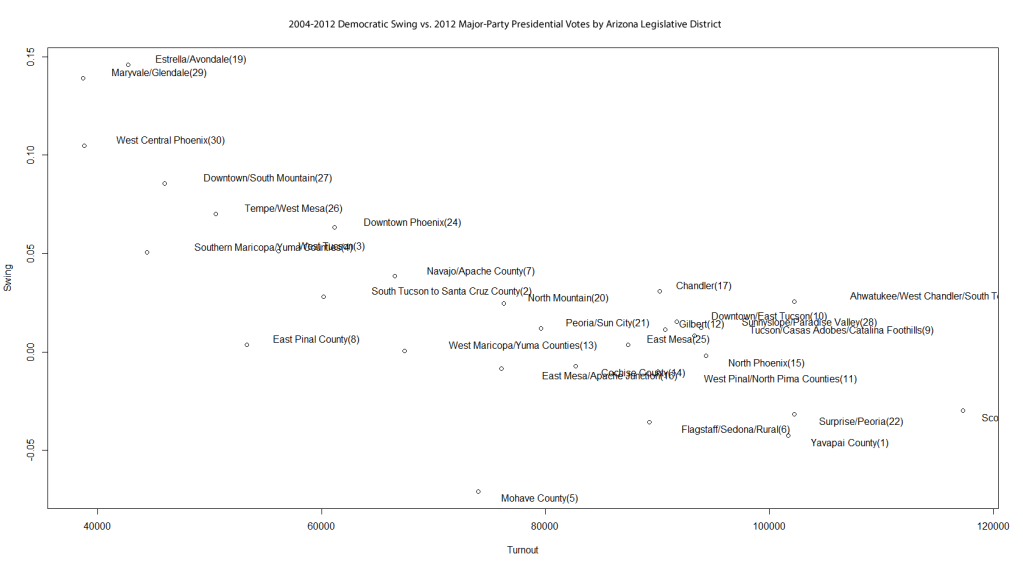
Hopefully, my graph also makes clear that--unfortunately for local Democrats--the "blue-trending" seats have incredibly low turnout. LD-29 (Maryvale/Glendale) cast just 38,699 votes for the major-party Presidential candidates; the lowest in the state.
Compare that to LD-23 (Scottsdale), which cast an amazing 117,308 Presidential votes!
This is, in fact, a consistent pattern, and an ominous one for Arizona Democrats. The more votes a district cast, the worse Obama did relative to Kerry. It's statistically-significant and everything. Slightly different names used here and in subsequent graphs:
Some of this isn't hard to explain. Again, these numbers are from the "tentative final" districts, but they should be about the same. LD-29--the one with the worst turnout in the state--had a Hispanic population of 142,923, but the 18+ Hispanic population was just 83,827, and the Hispanic citizen voting-age population was just 42,432. That means that about 60,000 people in this district are Hispanics below the age of 18, and half of the Hispanic adults aren't citizens. Between them, about half of the district's population isn't eligible to vote at all, and the Hispanic registration is just 25,590.
On the other hand, Scottsdale's LD-23 is the whitest district in the state, and also had the state's highest turnout. And Obama got just 36% of the two-party vote--a decent amount worse than Kerry (who got 38% or 39% of the vote).
Adjusted Turnout:
I swapped out the 18+ Hispanic population for the Hispanic CVAP (citizen voting-age population), and computed turnout as a percentage of this "adjusted" population, to see how much this was just about non-citizens.
The correlation between this "adjusted turnout" percentage, and both Obama's 2012 performance, as well as Obama's improvement over Kerry, seems to be small in magnitude (r-squareds of about 0.34 or 0.35 in either case) but strongly statistically significant. Here's the analogous "adjusted" graph:
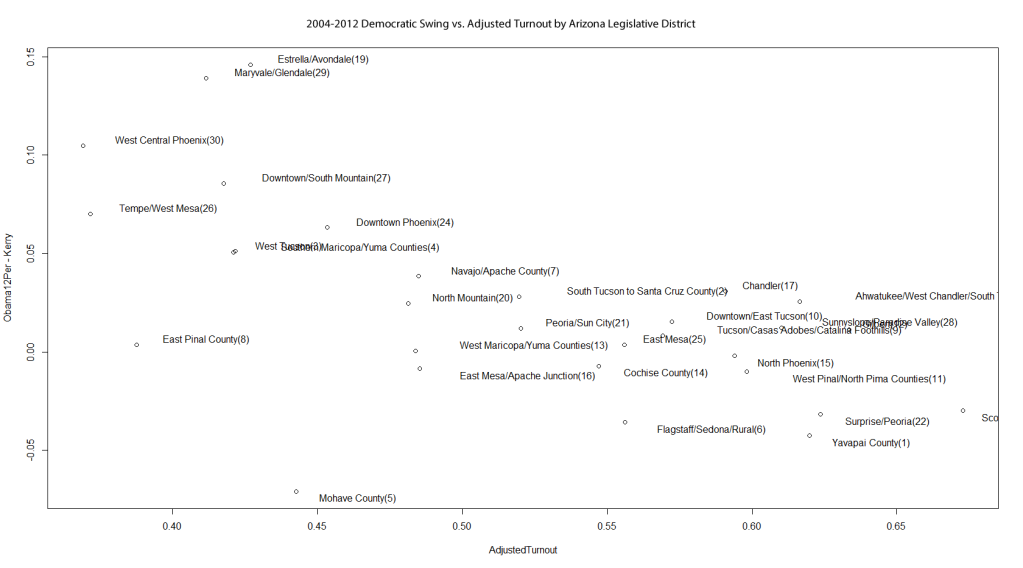
That suggests that Republican-leaning areas are turning out better than Democratically-leaning areas, and that Republican-trending areas are turning out better than Democratically-trending areas, even among the likely-eligible population.
Whatever the explanation, they're (presumably) votes Democrats aren't getting. I'm not sure how much this could be helped by registration drives and GOTV, although they might help a lot.
But some of it is surely that Arizona Republicans simply have higher-propensity voters than Arizona Democrats have.
Demographics, Turnout, and Mormonism:
The 2012 election was very highly racially polarized in Arizona. How racially-polarized? The adult non-Hispanic white percentage--a purely demographic figure-and Obama's results are correlated with an r-squared of 0.76.
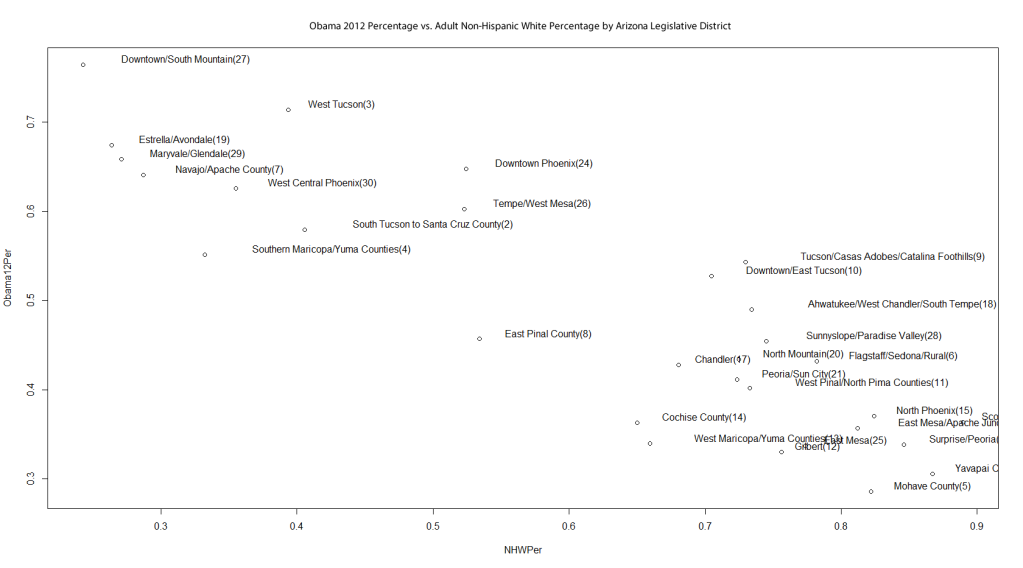
That plot is using the NHW percentage of the total population, but it doesn't seem to matter if you look at the "adjusted" population instead, although some of the details change.
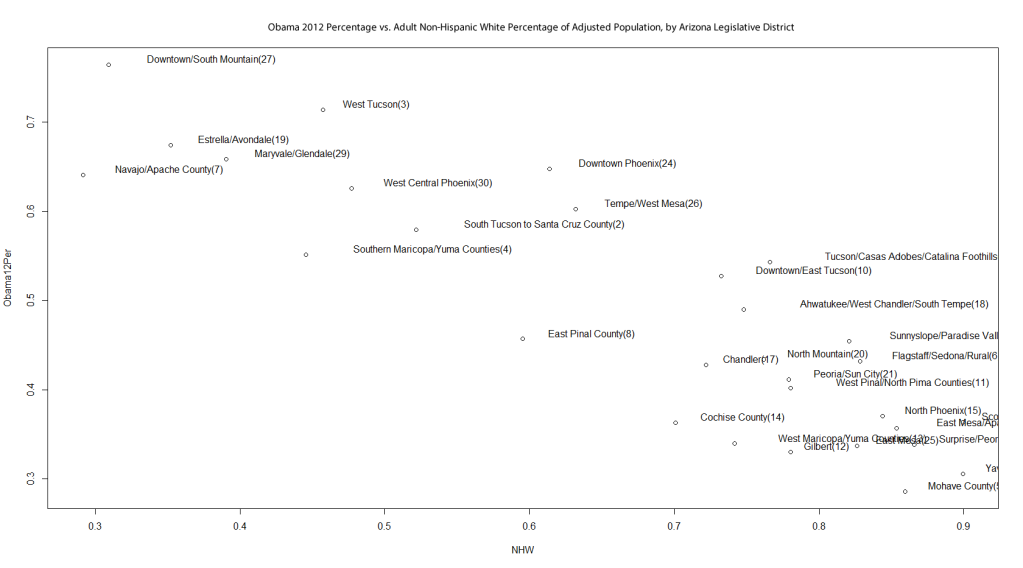
The adjusted NHW population remains strongly statistically significant in explaining Obama's 2012 results even when Kerry's results are accounted for. In other words, less white areas trended Democratic, and whiter areas trended Republican.
Frankly, I don't think Democrats are helped by this degree of racial polarization.
Although, as is the case nationally, we really don't know how much this was a particularly racially polarized election, presumably because of Barack Obama, and how much politics is simply becoming somewhat more racially polarized.
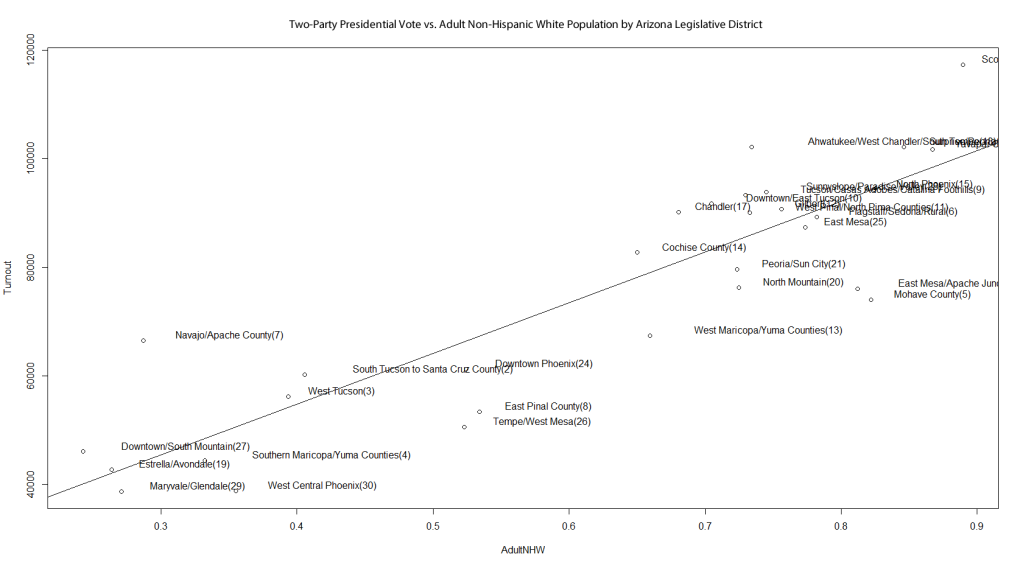
Arizona Democrats also aren't helped by the strong relationship between turnout and adult non-Hispanic white population (r-squared is about 0.77):
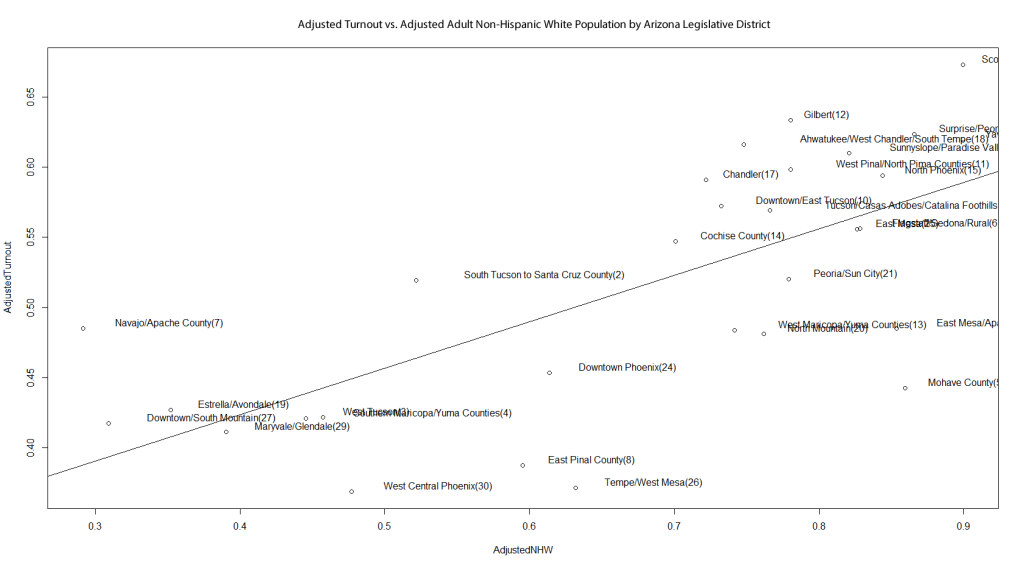
There's still a strong relationship, although the r-squared goes down to 0.47, even if you look at "adjusted" turnout and demographics--again, that just means I swapped out the 18+ Hispanic population for the Hispanic CVAP:
According to jncca, there are significant Mormon populations in Gilbert, Mesa, and Apache County (which is entirely contained in the Native American-majority LD-07). This, along with Mitt Romney at the top of the ticket, might account for some of the relatively high turnout in LD-07 and LD-12, but I haven't compared it to turnout in previous elections (for one thing, it'd be hard to account for the significant changes in population within the state).
On the other hand, I suspect LD-18 (though it has some of Mesa) and LD-23 simply have high turnout because of their relative affluence. I noticed in my diary on LD-28 that the posh town of Paradise Valley had surreal turnout for John McCain. CNN's exit polls actually don't show much of a relationship between income and the 2012 election results, but I don't know how much to trust exit polls, and in any case turnout is another issue.
Legislative Prospects:
Of course, even though these districts were drawn by a commission, they're still artificial entities. (Just artificial entities that happen to have a lot of easily accessible information.) Their most direct importance, of course, is that they elect members of the legislature. So how did Democrats do? Let's see the Ballotpedia results.
In the Senate, Democrats (of course) won all 12 Obama/Kerry districts, plus LD-08 in East Pinal County (and some of Gila County). Democrat Barbara McGuire may have been helped by a strong Libertarian candidate, Dean Dill--more on that, I suspect, in a later diary.
Democrats only came within single digits in the three districts I wrote diaries about: LD-06, LD-18, and LD-28. As you can see in my first scatterplot, these four seats form kind of a "cluster", although that's mostly because of Kerry's performance dropping sharply afterwards. Purely based on Obama's performance, Democrats might vaguely have prospects in LD-17 (Chandler) and in LD-20 (North Mountain; i.e., mid-northern Phoenix), although realistically these are highly Republican seats.
In LD-06 (Flagstaff, Sedona, and rural outlying areas), Democrat Tom Chabin kept it within 6 points or so even as Obama lost the seat by 14 points. This might be one of the areas where Obama's performance was a bit lower than it "should" have been, as the rural parts of LD-06 are probably quite Mormon (based on comments by jncca and by sacman701).
It was also an open seat, like LD-08 and unlike LD-18 and LD-28. And Chabin (like McGurie in District 8, and unlike Hydrick in LD-18 and Shelley in LD-28) was a state legislator. Still, an impressive performance even accounting for all of that.
I also wouldn't over-state Romney's effect in LD-06, since even in 2008 it was one of Obama's worst districts relative to Kerry.
House results were similar, except that Republicans won both House seats in LD-08, and Democrats traded a seat in "blue" LD-09 for a seat in "red" LD-28. In both cases this was probably because there were two candidates from one party running against one candidate from the other party for two seats (which is how Arizona elects its House). CF of Aus pointed this out.
Conclusion:
I've looked at a few different things in this diary, but they're basically all correlated: The higher-turnout districts were mostly the whiter districts, which were mostly the Republican districts, and they mostly got more Republican. The lower-turnout districts were mostly less-white districts, which were mostly the Democratic districts, and they mostly got more Democratic. I strongly suspect that, if I could account for median household income, that would correlate with some of this too, whatever CNN's exit polls say.
What does that mean for Arizona's future? I'm sure that GOTV operations, voter registration drives, and the "partisan activation" of an active Presidential campaign would do much for Democrats in the state.
But remember that just because Democratic districts have low turnout doesn't necessarily mean that Republican districts, and Republican areas in Democratic districts, couldn't produce more votes as well. A lot of people assert that Republicans are "tapped out" of support from their groups at this level or at that level and I don't always see a lot of evidence for that.
I also think that Arizona's 2012 election results might be a useful reminder that, even though there has been a lot of discussion of the Democrats' demographic advantages, Republicans have plenty of demographic advantages of their own.
Appendix:
Here are the Presidential results I calculated for each district, along with Obama's 2008 result and Kerry's result from the AIRC:
District DistrictName Obama12 Obama08 Kerry
1 Yavapai County(1) 30.60% 34.02% 34.85%
2 South Tucson to Santa Cruz County(2) 57.92% 56.77% 55.13%
3 West Tucson(3) 71.34% 67.24% 66.24%
4 Southern Maricopa/Yuma Counties(4) 55.16% 52.02% 50.12%
5 Mohave County(5) 28.63% 33.34% 35.71%
6 Flagstaff/Sedona/Rural(6) 43.17% 45.51% 46.75%
7 Navajo/Apache County(7) 64.07% 60.53% 60.23%
8 East Pinal County(8) 45.69% 44.34% 45.34%
9 Tucson/Casas Adobes/Catalina Foothills(9) 54.28% 54.47% 53.47%
10 Downtown/East Tucson(10) 52.74% 51.90% 51.21%
11 West Pinal/North Pima Counties(11) 40.21% 41.87% 41.23%
12 Gilbert(12) 33.05% 34.68% 31.92%
13 West Maricopa/Yuma Counties(13) 33.95% 34.96% 33.90%
14 Cochise County(14) 36.34% 36.88% 37.05%
15 North Phoenix(15) 37.06% 39.28% 37.26%
16 East Mesa/Apache Junction(16) 35.68% 38.06% 36.55%
17 Chandler(17) 42.79% 43.31% 39.73%
18 Ahwatukee/West Chandler/South Tempe(18) 49.02% 49.45% 46.45%
19 Estrella/Avondale(19) 67.41% 60.77% 52.83%
20 North Mountain(20) 43.42% 42.69% 40.95%
21 Peoria/Sun City(21) 41.17% 41.55% 39.97%
22 Surprise/Peoria(22) 33.84% 36.72% 37.00%
23 Scottsdale(23) 36.37% 40.41% 39.34%
24 Downtown Phoenix(24) 64.77% 61.64% 58.45%
25 East Mesa(25) 33.74% 34.89% 33.37%
26 Tempe/West Mesa(26) 60.23% 58.16% 53.22%
27 Downtown/South Mountain(27) 76.39% 71.14% 67.83%
28 Sunnyslope/Paradise Valley(28) 45.44% 46.01% 44.22%
29 Maryvale/Glendale(29) 65.83% 57.41% 51.92%
30 West Central Phoenix(30) 62.58% 54.84% 52.11%
1:30 PM PT: Should have added: As usual, I hope I didn't screw anything up, and I also hope for feedback from people with local knowledge.
