Welcome to the Climate Change News Roundup for 23 January 2011. I didn't get around to diarying the December 2010 arctic sea ice report, though others did (h/t FishoutofWater). The diary section of this roundup will report on January to date.
Also, see Magnifico's magnificent diary on record ice melt from the Greenland ice sheet!
More below.
Short-Term Climate: 1-20 January 2011
How has the climate behaved since the last year end? Let's start with a graphic that represents the height of a pressure surface, the 500-millibar surface to be exact. This level is at about the halfway point up in the atmosphere, in terms of total atmospheric mass, and is at about 5-6 kilometers above sea level. Anomalies in the height of that pressure surface are shown below.
500-millibar height anomalies, 1-20 January 2011
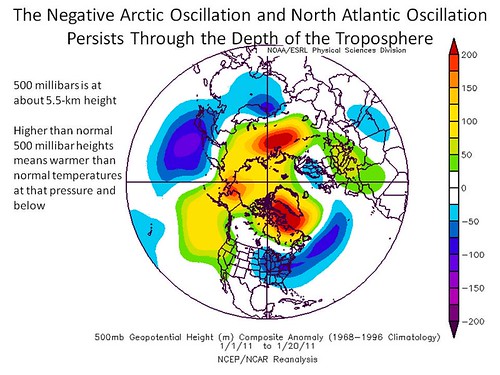
Note that the height of the 500-millibar pressure level is generally higher than normal in the Arctic. This is the negative phase of the Arctic Oscillation, and represents a continuation of last winter's pattern, which this season has existed since November 2010. It also means that the average temperature in the Arctic in the lower half of the atmosphere have been above normal, once again consistent with what has been observed.
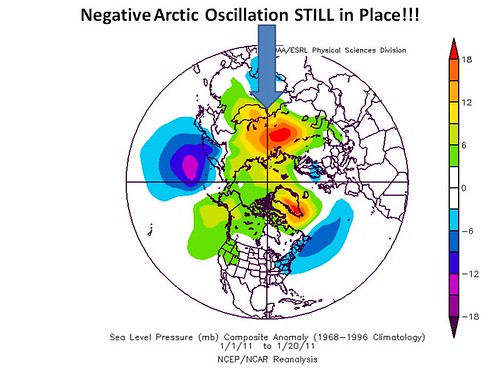
The mean sea level pressure anomalies for the 1-20 January period are remarkably similar to what we see at 500-millibars, as seen below.
Mean sea level pressure anomalies, 1-20 January 2011
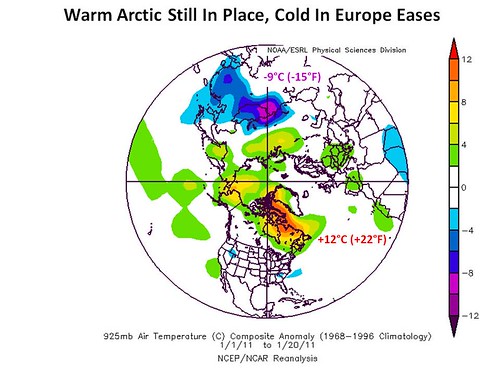
Finally, let's look at the 925-millibar temperature anomalies for the 1-20 January 2011 period. This is from the National Centers for Environmental Prediction in Washington DC, and the temperatures are in °C. The warm Arctic continues, with temperatures as much as 22°F above normal in the eastern Canadian Arctic near Greenland. North-central Siberia was as much as 16°F below normal. The early winter cold in Europe has largely eased over the past 3 weeks.
925-millibar temperature anomalies, 1-20 January 2011
State of the Arctic Sea Ice, 21 January 2011
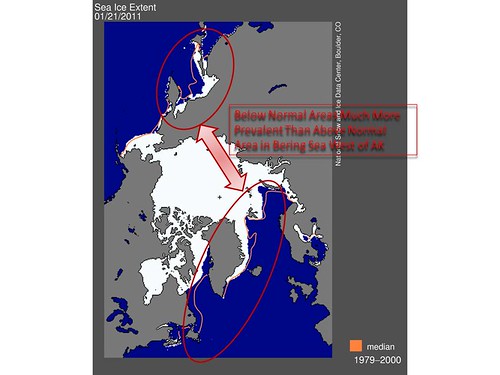
The record low mean December 2010 Arctic sea ice extent has not significantly recovered in January 2011 to date. The graphic below shows a "snapshot" of Arctic sea ice extent at 21 January 2011, from the National Snow and Ice Data Center. Ice extent is below normal everywhere except just west of AK in the Bering Sea, and just east of Greenland over a small area.
Arctic sea ice extent: 21 January 2011
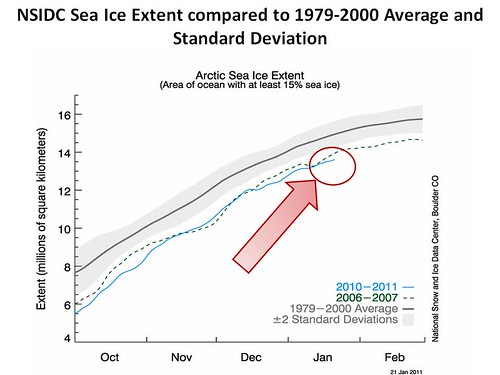
The time series from the NSIDC shows that the rate of increase in Arctic sea ice extent has been slower than the 1979-2000 normal, and that the 21 January 2011 extent is lower than it was on that date in 2007; the following September had the record minimum sea ice extent. It's also 4 standard deviations below normal, which only has less than an 0.01% chance of happening by chance, using the 1979-2000 statistics.
Time series of Arctic sea ice extent: 1 Oct - 28 Feb
Mean 1979-2000, 2006-7, and 2010-11
We use the International Arctic Research Center's satellite data to see how the current sea ice extent compares with years 2002 through 2010. The annual time series for each year is seen below.
Time series of Arctic sea ice extent: 2002 through 2010,
and 2011 through 21 January only
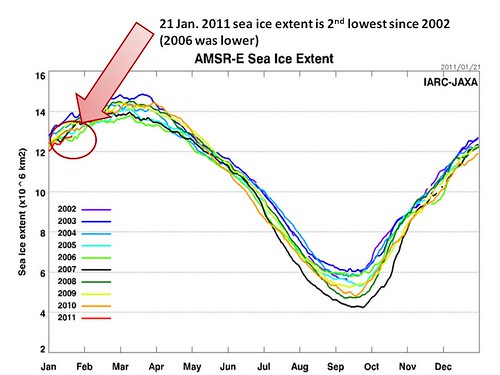
Here we see that 21 January 2011 has the 2nd lowest value for the date since 2002. The only year lower was 2006, which actually was followed by one of the higher minimum sea ice extents during the 2002-2010 period. Recall that 2007's minimum was the result of a variety of short-term climate factors coming together to produce rapid sea ice melt from June through August of that year. Those conditions were not present in 2006. Bottom line: without 2007 conditions this coming summer, it's less likely we'll set a new minimum sea ice extent.
Why don't I say impossible? Because of the loss of sea ice volume since 2006, the Arctic sea ice is much more vulnerable to melt than it was back then. Below is the trend in Arctic sea ice volume from 1979 to 31 December 2010, after removing the 1979-2009 seasonal cycle of daily mean sea ice volume. The data are constructed using a University of Washington Arctic sea ice model (PIOMAS) to assimilate and analyze atmospheric and ice data. Units are thousands of cubic kilometers.
Arctic sea ice VOLUME time series from PIOMAS, 1979-2010
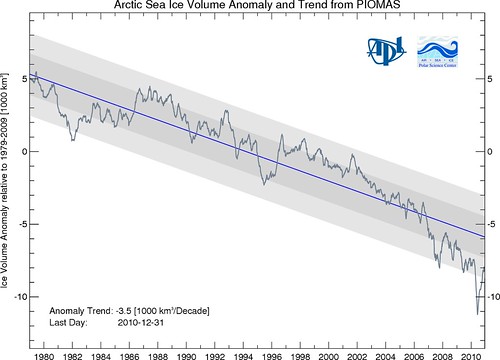
The volume (and mass) of Arctic sea ice has decreased dramatically over the last 30+ years, and the decrease is accelerating. This has been reflected in greater variability in the sea ice minimums as the sea ice becomes more sensitive to short-term anomalies in wind, temperature, and solar input.
What's interesting to me is the non-linearity of the process, even though a linear trend has been drawn through the data. We are approaching a physical limit in the system; a value beyond which the system cannot go, that being zero. But melt is not slowing as we approach that value, rather it is speeding up. I expect that, like the surprise minimum in 2007, we will come upon an ice-free summer Arctic suddenly, not linearly approach it in say, 20, 30, or 40 years. Time will tell.
Now for the Climate News Links.
========================================================================
========================================================================
CLIMATE CHANGE MONITORING NEWS
- Climate Change Could Be Worsening Effects of El Niño, La Niña
There's evidence cited by some scientists that El Niño and La Niña and their usual climate impacts may be increased by climate change. More on this follows.
- Now Historic Flooding Hits Southern Australia
25% of the state of Victoria in southeastern Australia is under water. Part of the reason for the severity of the flooding is that the atmosphere now contains 4 per cent more water vapor as a result of the increased global temperature of roughly 0.87°C.
As the planet continues to warm from the burning of fossil fuels, floods will get worse, but so will droughts.
- January 2011 Rio de Janeiro floods and mudslides.
Worst flooding in the area in history in terms of damage and extent, but not in terms of loss of life, necessarily. Of course, in 1967, forecasts and warnings were not as good in the U.S., and I suspect were nonexistent in Brazil, so the comparison is apples to oranges in terms of loss of life. 12" of rain fell in only a couple of hours.
- Scientists Find "Drastic" Shifts in Atlantic Currents Are Affecting Weather
Note that this is the opposite of the expectation of cold fresh meltwater cutting off the global ocean conveyor belt. But the warmer than normal water has been resulting in recent years in more atmospheric blocking (stagnant circulation patterns) in the high latitudes, and thus more anomalous weather for longer periods of time.
Scientists have found evidence of a "drastic" shift since the 1970s in north Atlantic Ocean currents that usually influence weather in the northern hemisphere ... The team of biochemists and oceanographers from Switzerland, Canada and the United States detected changes in deep sea Atlantic corals that indicated the declining influence of the cold northern Labrador Current.
- California's "Big One" Could Be Massive "Superstorm" that Floods State
If it happened, the impact would be greater than a major earthquake. Apparently, it is possible that CA winter storm with an "atmospheric river" moisture connection to the tropics could result in major flooding of the CA Central Valley, with huge consequences for agriculture and for the economy.
BP & FOSSIL FOOLISH NEWS
CLIMATE CHANGE & ENERGY
- Obama to Let 13 Oil Companies Drill Offshore with No Environmental Review.
No it's not quite as bad as the headline makes this sound; actually, these are grandfathered in, and will still have to follow new rules on assessing the worst case scenario environmental impact before they can go forward. Problem is that 10 of the 13 companies are doing exploratory wells, exactly the kind of well that blew up when the BP Gulf disaster occurred. And it appears that Mr. Obama caved (how surprising) to Gulf and GOP politicians.
- Nuclear Energy Suffers Another Big Blow: Will the dying industry continue to beg for more government subsidies?.
The big blow was the failure of the Omnibus spending bill, which contained $7 billion in new subsidies for nuclear power. But there are other goings-on around the world that seem to indicate trouble for the nuclear industry, including large cost overruns for French and Finnish plants, and increases of $1 billion in rates in Georgia to cover construction of two plants, along with billions in federal subsidies.
- How South America's Rainforests Are Being Sacrificed on the Altar of Energy
With roads, power lines, and the water that will cover land, the 5 dams being constructed in cooperation with Brazil to meet energy needs may destroy 1.5 million hectares (3.55 million acres) of tropical rainforest.
CLIMATE CHANGE POLICY/POLITICS/ECONOMICS
- Green Energy Opponents Are the Real Job Killers.
Green jobs and green infrastructure are not the "job-killers" that the GOP and carbon energy companies claim. A study in 2009 showed that for every dollar invested on green infrastructure, we get $2 in return. A specific item below:
For example, to charge a plug-in hybrid or fully electric vehicle with wind power costs the equivalent of well under $1 for a gallon of gas. And that money stays in America.
So who would spread the falsehood about green energy? Could it be "the very fossil fuel forces whose policies will guarantee the economic decline of America"? You betcha!
- Vision: Green jobs are not just for blue states.
Kentucky has lost 16% of its manufacturing and 23% of its construction jobs. 70-80% of the green energy jobs are in construction. Green jobs grew 10% between 1998 and 2007 in KY while other jobs only grew 3.6% in number; this even without a green energy policy. The article talks about other red and swing states that have seen similar results ... even more if they've pursued green energy development.
- New House Science Committee Chair Ralph Hall (R-TX) Threatens to Subpoena Climate Scientists
I think this story has been covered elsewhere on DKos, but believe it's still worth repeating. The surprise here is the quote regarding the BP oil spill and how it demonstrated the amount of energy available in the Gulf of Mexico for exploitation:
As we saw that thing bubbling out, blossoming out – all that energy, every minute of every hour of every day of every week – that was tremendous to me. That we could deliver that kind of energy out there – even on an explosion. Dallas News, 13 December 2010
- Vision: Kenya enshrines the environment in its constitution -- this should be our future
Here's the addition to the Kenyan Constitution:
Article 42: Every person has the right to a clean and healthy environment, which includes the right ... to have the environment protected for the benefit of present and future generations through legislative and other measures.
Other "third-world" countries such as Ecuador have also addressed the environment as part of the commons we all share. They're taking the lead.
WATER, AGRICULTURE & NATURAL RESOURCES
WILDLIFE & ENDANGERED SPECIES
- Great Barrier Reef Hit Hard by Australian Flooding.
Coral reefs have been impacted by bleaching from warmer-than-normal ocean temperatures in the Caribbean, Pacific, and elsewhere. Here's a case where flooding from Queensland may have a seriously deleterious impact.
That's all folks, for now.
