I'm going to deal with this installment a little differently than before. I've got four really good versions that I think all deserve to be seen by the Daily Kos Elections community. At the end of the diary, I'm going to have a poll for everyone to vote on which one is best for Democrats by whichever criteria that you think the maps should be judged on.
A note before we begin: None of the maps have a majority African American district. I do not believe that it is required under the Voting Rights Act to make the effort to keep the 11th over the 50%+1 line. It is not possible to keep the 11th at the benchmark level in a compact way. In order to maintain African American majority status, you have to take in the minority communities of Akron (be definition not compact). An action that would absolutely screw Democrats in every area of the state.
A second (added) note: The average is actually of 2006, not 2008 as DRA's summary says. Multiple astute observers have pointed out to me that there were no other statewide races in 2008, something that I neglected to notice myself! I'll leave the references to the "2008 average" in the diary, but only because I don't want to waste time changing everything.
This diary has been posted to DK Elections, an official Daily Kos sub-site. Please read the DKE Mission Statement. Our focus is on electoral politics rather than policy or preference. Welcome aboard!
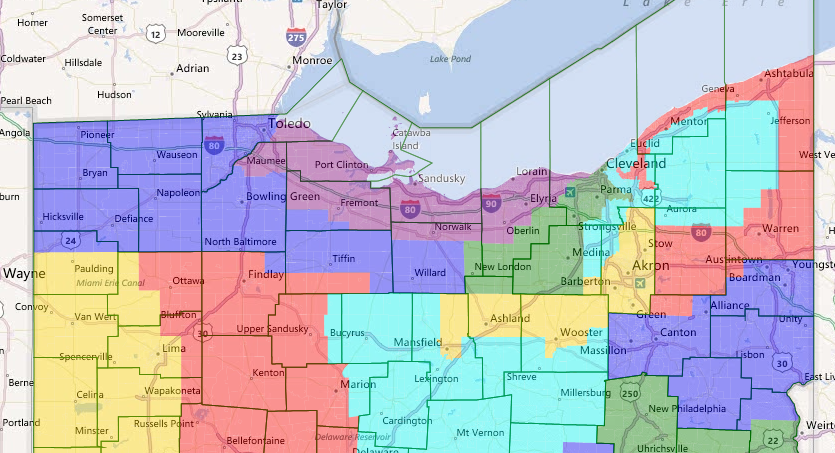 Northern Districts Version 1
5th (Purple, Elyria, Loraine, Sandusky) Likely Democratic at 56.5% Obama and 60.2% average Democratic in 2008. Bush probably won this district narrowly, I'd imagine, but even that would result in a D+2ish PVI with admittedly strong local Democratic roots.
9th (Blue, Toledo and Bowling Green) Marcy Kaptur and Bob Latta get thrown together in this Likely Democratic district which supported Obama (57.6%) and Democrats on average (58.8%) in 2008.
10th (Green, Cleveland) The awful Dennis Kucinich would get a district to run in and its a district that by all means is safe at 57.2% Obama and 62.9% average.
11th (Cyan, Cleveland) Marcia Fudge would have a different type of primary challenge on her hands: instead of worrying about challenges from African Americans, she'd have to worry about challenges from the white working class. Whoever wins in this 67.9% Obama district (68.5% average) would be ensured of election in November. African Americans are 39.4% of the VAP, while whites (among whom about half are probably Democrats going by the Obama numbers) make up 56.7%. That still gives a good advantage for an African American candidate, but not enough to sit tight. The good thing about this? A district like this aligns political pressures in a way that can produce a good statewide candidate.
13th (Gold, Akron) Renacci and Sutton would still be duking it out in a district like this, but instead of territory favoring Renacci we'd be looking at a more even playing field. Only 55.1% Obama and 59.8% average Democratic in 2008. That's good enough only for lean in my book, but an argument can be made for likely.
14th (Red, Cleveland, Lake County, Ashtabula, and Warren) Safely Democratic at 57.5% Obama and 63.8% average Democratic performance. Tim Ryan would cream any Republican coming after him. He'd probably get a primary challenge from a limousine liberal from Lake County.
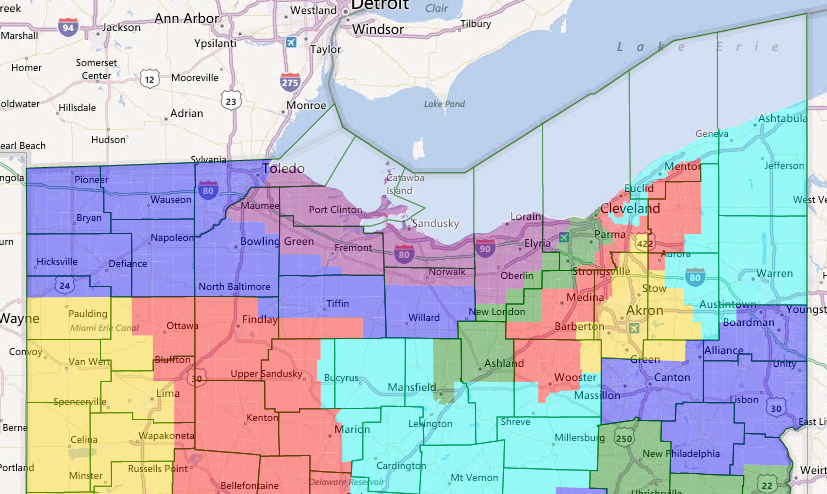
Northern Districts Version 2
5th (Purple, Elyria, Loraine, and Sandusky) This district is slightly more Republican than the version above, so only lean instead of likely Democratic. 54.9% Obama, 59.0% average Democratic.
9th (Blue, Toledo and Bowling Green) This district had a few precinct changes, but the election data is exactly the same.
10th (Green, Cleveland) This district is a bit safer than the above version at 58.3% Obama and 63.9% average Democratic.
11th (Red, Cleveland) This district is still safe, but the demographics changed somewhat. The major difference is that the white population is probably more conservative ensuring better dominance in the Democratic primary for an African American candidates despite a slight decrease in the African American percentages at 38.8% and slightly increased white percentage at 57.6%.
13th (Gold, Akron) A good trade off from the 5th's decrease in performance is the 13th's increase. Now a likely Democratic district at 56.7% Obama and 61.9% average Democratic performance.
14th (Cyan, Cleveland, Lake County, Ashtabula, and Warren) A slight decrease in Democratic performance, but still Safely Democratic, at 57.3% Obama and 63.1% average Democratic performance.
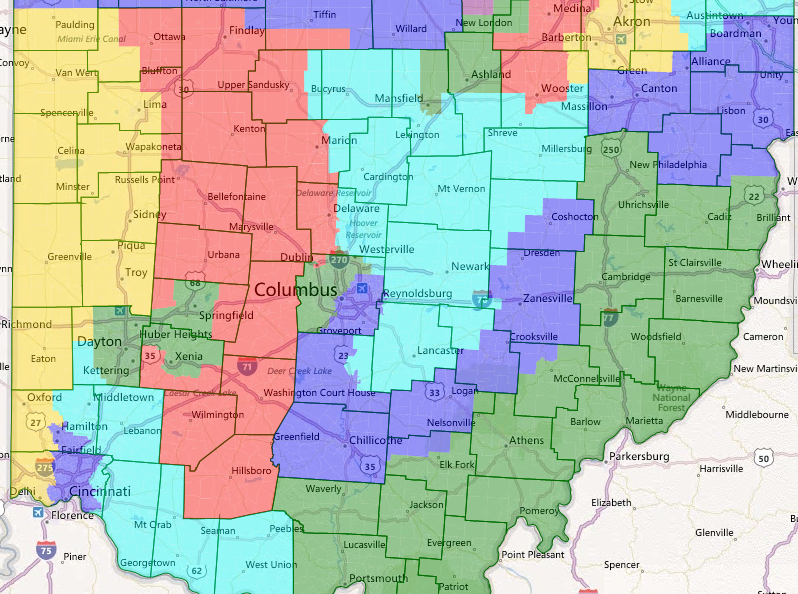
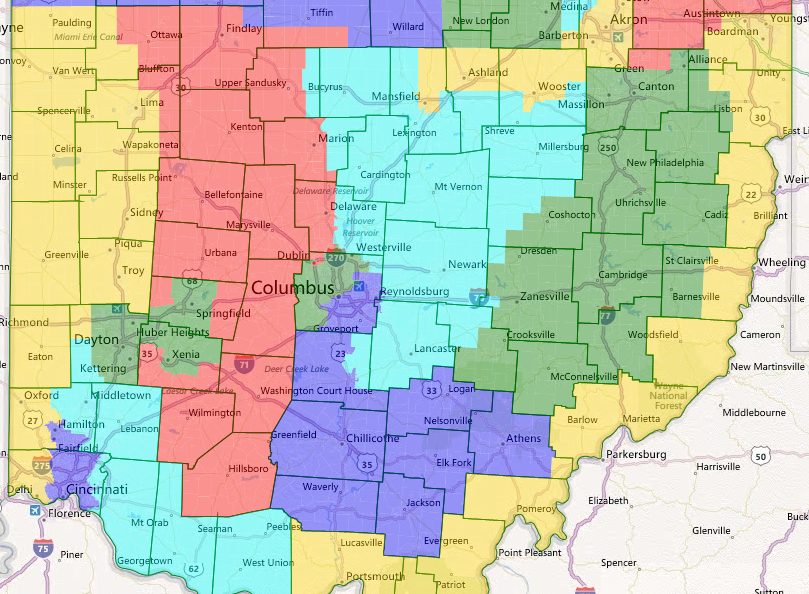
Southern Districts Version 1
1st (Blue, Cincinnati) This district becomes likely, tilting toward safely, Democratic by only taking in precincts in Hamilton County that are 40%+ Obama and then venturing northward into Butler County to take in Fairfield and Hamilton. 59.4% Obama and 55.5% average Democrat (the average for Ohio are all statewide races in 2008). This area is also rapidly trending our way, which means that as the decade wore on it would become safe. At 27.5% I actually think an African American could win the primary. Current Cincinnati Mayor Mark Mallory is an exceptionally attractive candidate for the Democrats.
2nd (Cyan, Cincinnati suburbs) Completely unwinnable at 33.6%.
3rd (Green, Dayton and Springfield) This district is probably leaning Republican, but not so far to classify it as a "winnable" race so I'm going with tossup status. A substantial 17.3% African American minority, 52.2% Obama, and 51.1% Democratic average.
4th (Red, Dayton and Columbus suburbs, Marion, Urbana, and Findlay) 37.2% Obama, totally unwinnable. Multiple Republican incumbents live in this district: Jim Jordan and Steve Austria. I'd put my money on Steve Austria, who represents most of this district whereas Jim Jordan's base of Greene County is mostly excised into the 3rd.
6th (Green, Ohio River Valley) Obama narrowly lost this district with 47.5% of the vote, but Democrats in 2008 totally destroyed Republicans with 61.0%. Honestly, my heart says to place this at Leaning Democrat, but my gut is telling me tossup because of the removal of strongly Democratic areas just south of Youngstown.
7th (Cyan, Central Ohio) Dominated by Columbus suburbs this district is completely unwinnable at 38.0% Obama. Pat Tiberi and Bob Gibbs are thrown in together here. My money would be on Bob Gibbs, who represents most of the geographic area and probably more of the population as well.
8th (Gold, Cincinnati suburbs, I-75 corridor) Although Boehner doesn't live in the district, he'd be completely safe - as would any Republican - in this 32.4% Obama district.
12th (Blue, Columbus, Chillicothe, Zanesville) Likely Democratic at 57.9% Obama and 59.2% Democratic average performance in 2008. I doubt even Bush was able to win this district in 2004 if only because of the 20.7% African American minority. I think that it would be possible for an African American, like Joyce Beatty, to win here but it would take a good amount of crossover support from white Democrats. More likely we'd see a Kilroy type winning.
15th (Green, Columbus) In this other Columbus district, Obama outperformed other Democrats with 57.3% support to their average 56.0% support. I'd still put it at Likely Democratic, though, because the trend is towards us here (just as with the 12th).
16th (Blue, Canton and Youngstown) A likely Democratic seat which supported Obama with only 55.0% of the vote. Local Democrats did substantially better (like in the 6th) and won 62.3%. Boccieri would be a good fit here.
Southern Districts Version 2
Note: Districts 1-4, 7, and 8 are exactly the same as the first version.
6 (Gold, Youngstown and Ohio River Valley) I actually like this version of the district more. It takes in Youngstown and hews more closely to the river such that Obama won 51.4% to McCain's 46.6% and Democrats utterly destroyed Republicans 66.4% to 33.6%. I'm not hesitant at calling this one safely Democratic.
12th (Blue, Columbus, Chillicothe, and Athens) This version moves out of the safest edge of likely into safely Democratic territory. Obama won here 58.1% and Democrats killed with 60.1%. The African American percentage decreased to 18.6% VAP, though, because of the switches of precincts between it and the 15th. If you didn't change the 15th at all and left the boundary between the 12th and the 15th the same (while still making the change between the 12th, 6th, and 16th, the 12th would be over 59% Obama and like 62% average, so I wanted to spread that wealth around... :P).
15th (Green, Columbus) 58.6% Obama and 57.0% average Democratic in 2008. This is still only likely Democratic, but closer to safe instead of closer to lean as with the previous map.
16th (Green, Canton and Zanesville) All of the increases in Democratic performance in the other districts have the effect of making this district much less Democratic. Only 50.0% Obama (47.6% McCain) and 55.5% average Democratic in 2008. I'd call this a tossup.
Summaries
So, there are four possible combinations, but before we get to those let me summarize the differences between the two version of the north and south.
North: The main difference here is which seats are rated as what. Both versions have 3 Safe, 2 Likely, and 1 Lean Democratic seat, but which of the seats is Lean? In the first version it is the Akron based 13th and in the second version it is the Coastal based 5th. In the opposite version those districts are likely. Wherever you think Democrats stand a better chance of electing their candidate in the lean district (Akron or Coastal) is the version you should prefer. Personally, I prefer the second version because the strength in the Akron seat is traded for only a small dent in performance on the 5th (from the leaning side of likely to the likely side of leaning).
South: The main difference here is the race ratings themselves. In the first version there are 4 Likely, 4 Unwinnable, and 2 Tossups. In the second version there are 2 Safe, 2 Likely, 4 Unwinnable, and 2 Tossups. When only considering the districts that changed between the two versions (the 6th, 12th, 15th, and 16th) the first version has 3 Likely and 1 Tossup and in the second version there are 2 Safe, 1 Likely, and 1 Tossup. Again this is a choice of pick your poison. Which of the two tossup seats do you think is easier to win? An Ohio River Valley district or the Canton district? Personally I'd rather have the 3 Likelies and a tossup we'd be favored in because of ancestral strength.
If you have either Northern Districts version and Southern Districts Version 1:
3 Safe, 6 Likely, 1 Lean, 2 Tossup, 4 Unwinnable
If you have either Northern Districts version and Southern Districts Version 2:
5 Safe, 4 Likely, 1 Lean, 2 Tossup, 4 Unwinnable
Personally, I prefer the second version of the North and the first version of the South. The ratings below will reflect that. I'm not going to take part in my own poll.
Recap
Pennsylvania
7 Safe, 3 Likely, 3 Tossup, 5 Non-Winnable
New York
15 Safe, 5 Likely, 2 Lean, 3 Tossup, 1 Winnable, 1 Non-Winnable
At Large and The South
See comments for changes to Georgia, North Carolina, and Virginia
26 Safe, 7 Likely, 2 Lean, 9 Tossup, 11 Winnable, 35 Non-Winnable
California
See comments for changes to certain districts
28 Safe, 8 Likely, 4 Lean, 3 Tossup, 5 Winnable, 5 Non-Winnable
Texas
Uses the changed 17th
17 Safe, 1 Likely, 1 Winnable, 17 Non-Winnable
Maryland
8 Safe
Ohio
3 Safe, 6 Likely, 1 Lean, 2 Tossup, 4 Unwinnable
Total
104 Safe, 30 Likely, 9 Lean, 20 Tossup, 18 Winnable, 67 Non-Winnable
