In this diary, we will preview the South Carolina primary, going though the details of how delegates are allocated by Congressional district, running through the demographics, and considering different possible scenarios. We will also look at actual voter file data from South Carolina showing who has voted in previous Democratic primaries, and compare that data to exit polls. The results may surprise you, and could have implications for the results of the 2016 South Carolina primary. I will also explain a bit more how my model is treating state polls — which is the main reason why my model has a more optimistic forecast for Sanders than does 538.
It’s essentially a given that Hillary Clinton will win South Carolina. The only question is the margin by which she does so. She is ahead in all the polls there, and the demographics of the state are extremely favorable for her. To a greater extent than in any other state besides (maybe) Mississippi, Louisiana, or Georgia, the electorate will be disproportionately old, disproportionately female, and disproportionately African American. In fact, I would argue that the most important number to come out of South Carolina will not be the share of the vote that was cast by African Americans. In Nevada exit polls, that number went down slightly in comparison to 2008. However, exit polls can get these things wrong. There are several reasons to think that African American vote share could go up, but also at least one reason to think that it is at least possible that it could actually go dowBern (Obama’s absence from the ballot). If African American vote share is higher than in 2008, that will be a good sign for Clinton heading into other deep-south Super Tuesday states. If not, that will be a good sign for Sanders.
But those of us who support Sanders should not get too excited if African American turnout is down, even if that would help Sanders — Democrats need African Americans to vote in November, and if African American turnout is down in the primary, that would be a bad sign for the General election. Ultimately though, if African American vote share goes down, I suspect it is most likely to be related to a decline in White turnout.
South Carolina Projection
Currently, my model predicts that Clinton should win South Carolina by about 61.6% to 38.4%, with a margin of 32 delegates to 21.

The strange thing is that within reasonable bounds, the margin by which Clinton beats Sanders probably won't shouldn't make much of a difference in the final delegate allocation. The only additional delegate within reach for Sanders is an additional At Large delegate if he were to do 2.5% better than projected statewide. For Clinton, there are three additional delegates that are within potential reach in SC-04, SC-06, and by winning 5-2 split among the PLEO delegates (which are allocated statewide). For more details on delegates, I direct you to Torilahures diary on the subject of SC delegates.
This delegate math is the reason why Bernie Sanders has been spending a lot of his time recently in Super Tuesday states like Massachusetts, Minnesota, and Oklahoma (as well as in later voting states like Ohio, Kansas/Missouri, and Illinois), and is also the reason why Clinton is now also spending a lot of her time already campaigning in the Super Tuesday states. It simply doesn't make mathematical sense, in terms of delegates, for either candidate to focus overly on just South Carolina. And that’s especially true for Sanders.
South Carolina Demographics
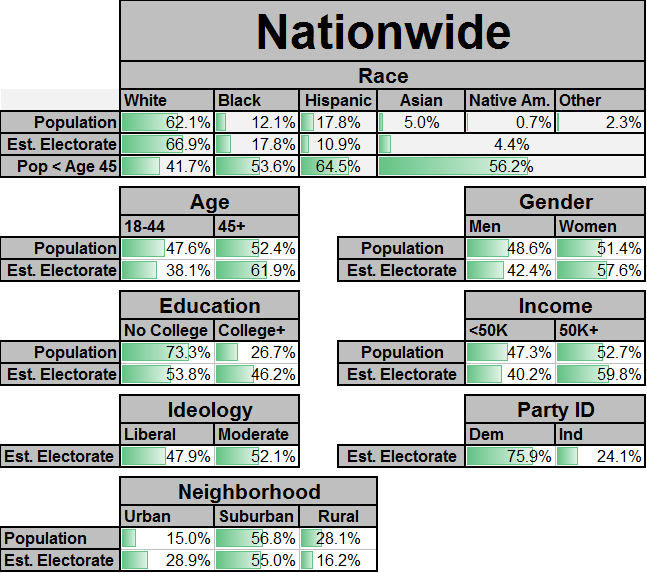
The Demographics of South Carolina are shown below. When South Carolina has a larger share of a demographic category than the national average, it is colored in green. When it has less than the national average, it is colored in red:

Compared to the national average (shown in the chart below), South Carolina obviously has a much larger African American population. Another relevant fact to note is that not only is the African American population larger than the national average, but South Carolina African Americans are also (on average) older than African Americans are nationally. That makes South Carolina African Americans an even better demographic for Clinton than African Americans are in general. In the 2008 Democratic primary, the electorate was also older than average, more moderate, less well educated than average, and lower income than average. The former two factors should help Clinton. The latter two might help Sanders, except for the fact that they are correlated with the African American population because of the historical mistreatment and lack of opportunity afforded to African Americans in the south.
Demographic Details for each Congressional District
During Congressional redistricting in 2010, White Republicans decided to disenfranchise African American voters by only drawing a single district in which African American voters could elect a candidate of their choice (even though two were easily possible). One unintended side effect of this is that every Congressional district in South Carolina has a large African American population, because all of the African Americans who do not live in SC-06 are divided among the other white-dominated GOP districts. That, in turn, means that Hillary Clinton is extremely likely to win every single Congressional district in South Carolina. Still, Sanders should walk away with some delegates in each district.
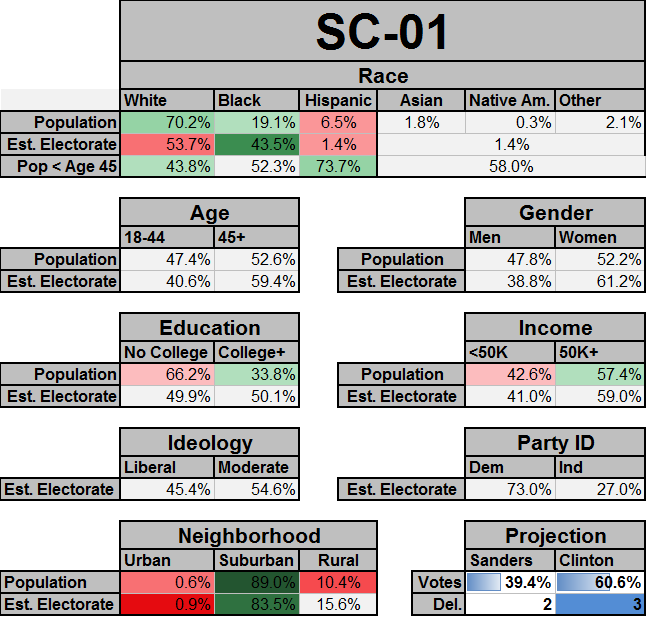
SC-01 is based in Charleston and along the coast (including Hilton head). It is the most urban district in the state. It is also higher income and higher education than the national average, which makes it an exception in South Carolina. Sanders may do ok among whites — a disproportionate number of whites here are retirees from the north. But the fact that those voters are older hurts Sanders, and Sanders has tended to do a bit better with lower income, lower education working class whites.
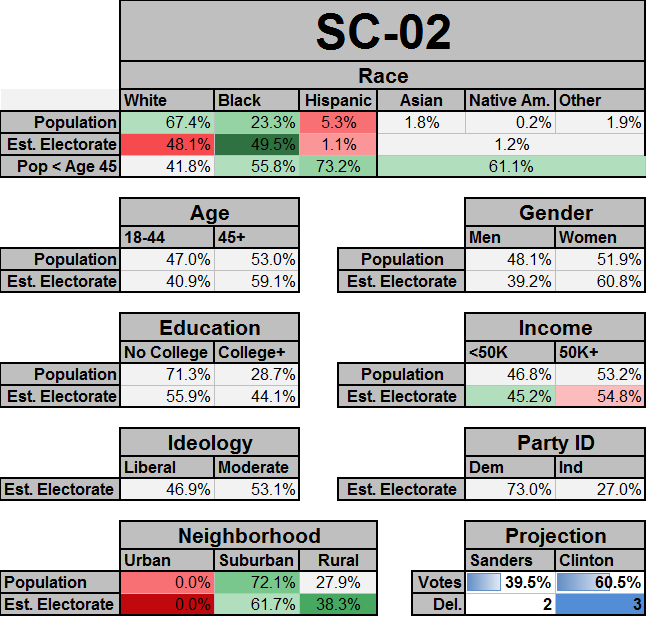
SC-02 includes the whiter parts of Columbia and stretches towards the Georgia border and Aiken. Again, the African American population is smaller than the statewide average, but it still plenty large up to make a large share of the electorate. This district is relatively suburban, and Sanders has done less well with suburban voters than with urban and rural voters so far.
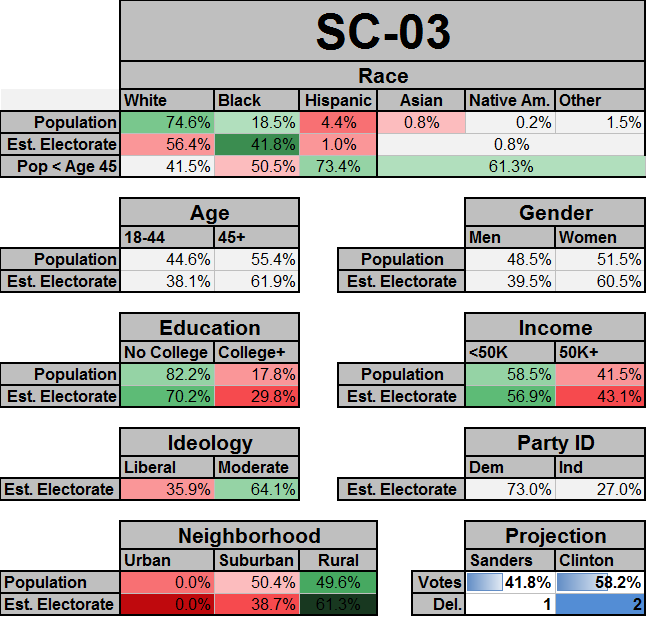
SC-03 is an “upcountry district" in the North. The African American population is too high for Sanders to have a realistic shot of winning the district. Still, it should be one of Sanders’ better districts in the state. This district does have some of the sorts of rural, less educated, lower income working class white voters that supported Clinton in 2008 but that are attracted to Sanders this time around. Clemson University is also located here, but Sanders will have difficulty doing as well with Southern white college students (many of whom are Republican) as with students in the rest of the country.
Keep an eye on the counties in the very northwestern corner of the state — Oconee, Pickens, and Anderson. If Sanders wins those, that is a very good sign for him for the rest of the campaign. If he can win there, it suggests that he will be able to appeal to working class white voters in Appalachia. That would be good news for him in Appalachian Virginia (VA-09), in parts of rural Tennessee, in Oklahoma, and further ahead in the calendar in places like Western Pennsylvania, Southwest Ohio, West Virginia, and Kentucky. These were all areas that backed Clinton solidly over Obama in 2008. If Sanders can win those voters this time, that makes his path to victory considerably more realistic and viable.
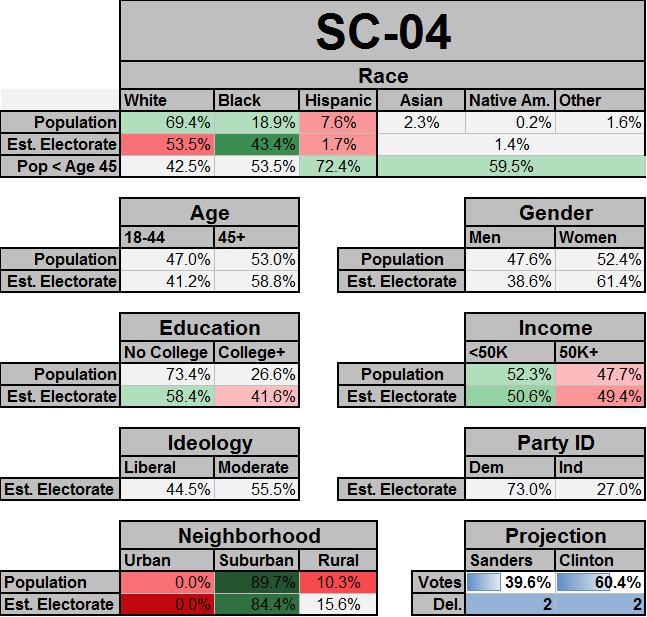
SC-04 is another “upcountry district,” but still has a fairly large African American population, which again should be plenty to ensure that Clinton wins the district. Sanders could do relatively well here among working class white voters, but this district’s suburbanness hurts him. Delegates should split 2-2, unless Clinton wins a particularly large statewide victory.
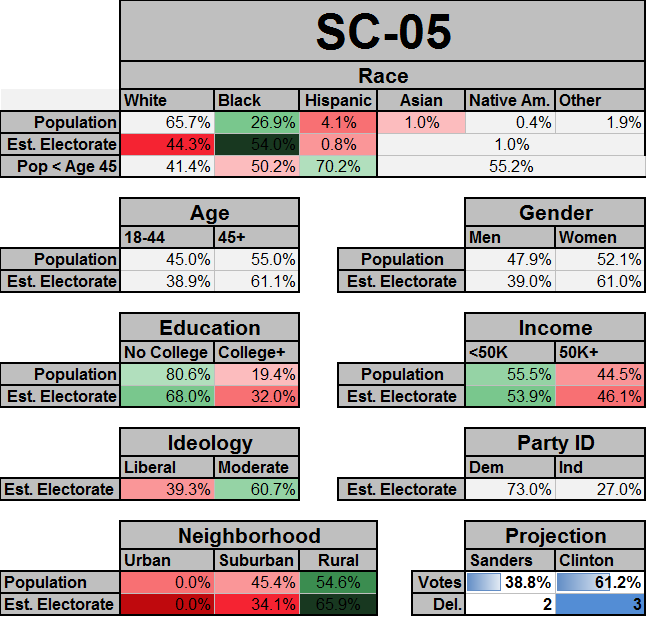
SC-05 includes Charlotte suburbs like Rock Hill, as well as Gaffney and outlying areas around Columbia. Again, there is a large enough number of African Americans for Clinton to win easily. Sanders may fare reasonably well among the rural white voters here, however, while Clinton will probably do relatively better in the Charlotte suburbs.
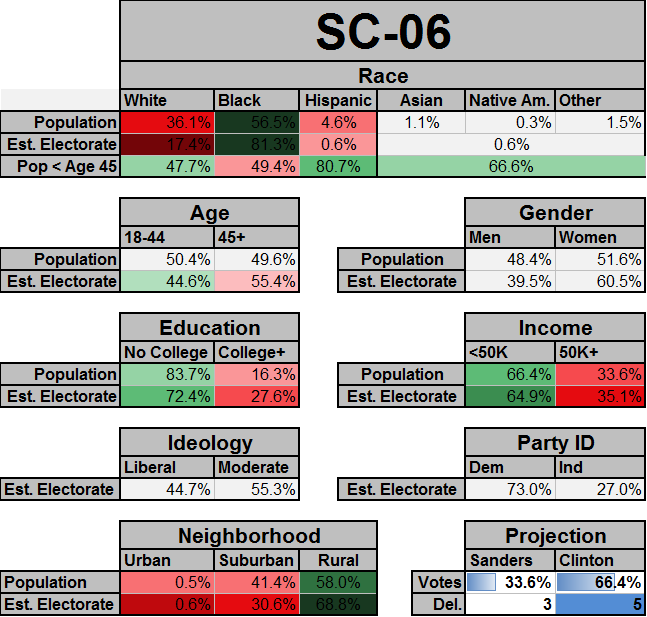
SC-06 is the African American majority district in South Carolina (represented by Jim Clyburn). The electorate will be overwhelmingly African American. Obviously, Hillary Clinton will do very well here. The model projects a 5-3 delegate split, but with a good outcome for her she could potentially win a 6-2 split, if her support from African Americans is as solid as she would like it to be. Clinton may show a tendency to do better among African Americans who live in heavily African American neighborhoods than among African Americans who live in less heavily African American neighborhoods. If so, that will tend to help her even more here — because that is not taken into account by the model.
However, this district does include a lot of Charleston and Columbia, including the University of Columbia. So there are some white liberals here, and they should help Sanders from falling too far through the floor in this district.
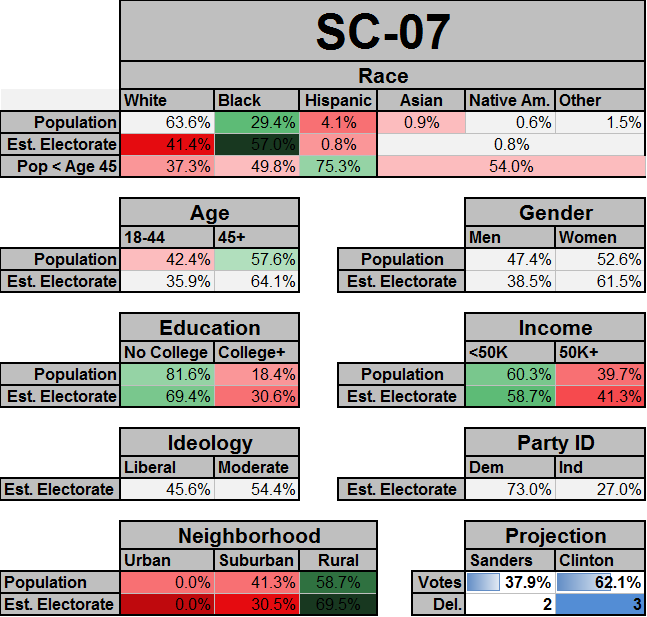
SC-07 runs along the North Carolina border. There are some working class white voters with whom Sanders could get some support, but again, the African American population is too large for him to win outright. Sanders could be competitive in Horry County (Myrtle Beach), but I am not sure I would bet that he'll win it - because of the large numbers of retirees.
What if Clinton only wins by 10% statewide?
What if Bernie Sanders substantially over-performed expectations and only lost by about 10%? How many delegates would he gain? Not many:
 Projected
If Sanders won 45% of the vote, he might only get 22 delegates. That is just a single delegate more than the model projects that he would get with 38% of the vote. That delegate math, again, is why it doesn't make sense for Sanders to spend all of his time in South Carolina. And that’s why he’ll be in Dallas and Austin TX.
What if Clinton wins a larger landslide (66.6%-33.4%)
What if Clinton wins a larger landslide? This is what is currently being projected by 538's Polls-Only forecast. Their “Polls-Plus” model forecasts that Clinton will do even better (more like 70-30). If 538’s Polls-Only forecast is roughly correct, the outcome on the Congressional district level should look something like this:

Clinton would be likely to gain a few additional delegates in this scenario, but not a huge number more than she would get if she did about 5 points worse. She gets 35 delegates here, compared to 31 with 62% of the vote.
Comparison between my model's prediction and 538’s prediction
538's polls-only forecast currently has Clinton up by 64.5% — 31.3% (66.6% — 33.4% if you split the undecideds evenly). They also have Clinton up by even more in their polls-plus forecast: 67.1% — 28.6% (or 69.25% — 30.75% if you split undecideds evenly). I should say that 538's forecasts are really a range, not a point estimate. My model makes point estimates rather than giving an explicit range because it is not Bayesian.
By comparison, my model’s predictions are substantially better for Sanders (but still quite good for Clinton). Why is this? Part of it comes from the fact that my model does not just consider state polls, but also incorporates national polls and demographic data. But in fact, my model thinks Sanders is doing better in state polls than it expects based off of demographics and national polls. If state polls were not considered, my model would say that Clinton should beat Sanders by about 64.3% to 35.7%. 79% of my model's prediction is coming via the state polls, while the remaining 21% is coming via these national poll/demographics based numbers.
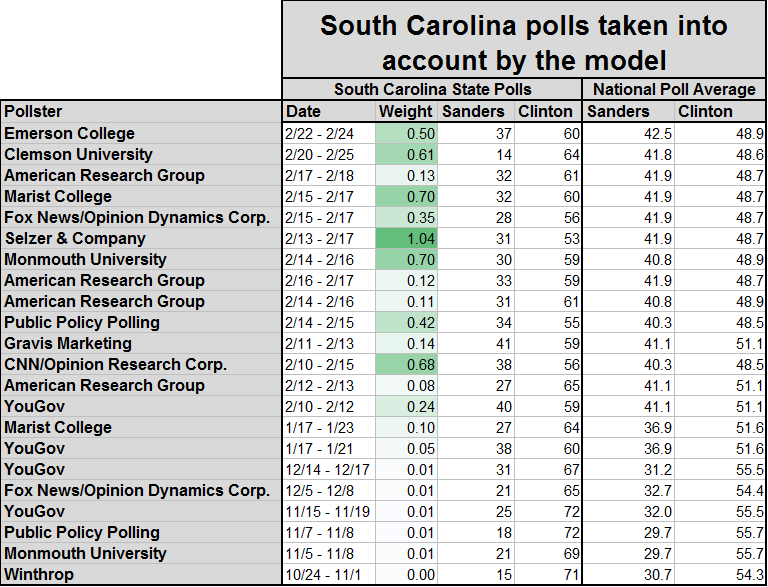
Much of the difference between my model’s projection and 538’s projections comes from how we are weighting the state polls. Here are the weights that I am using for state polls in my model:
And here are the weights that 538 is using:
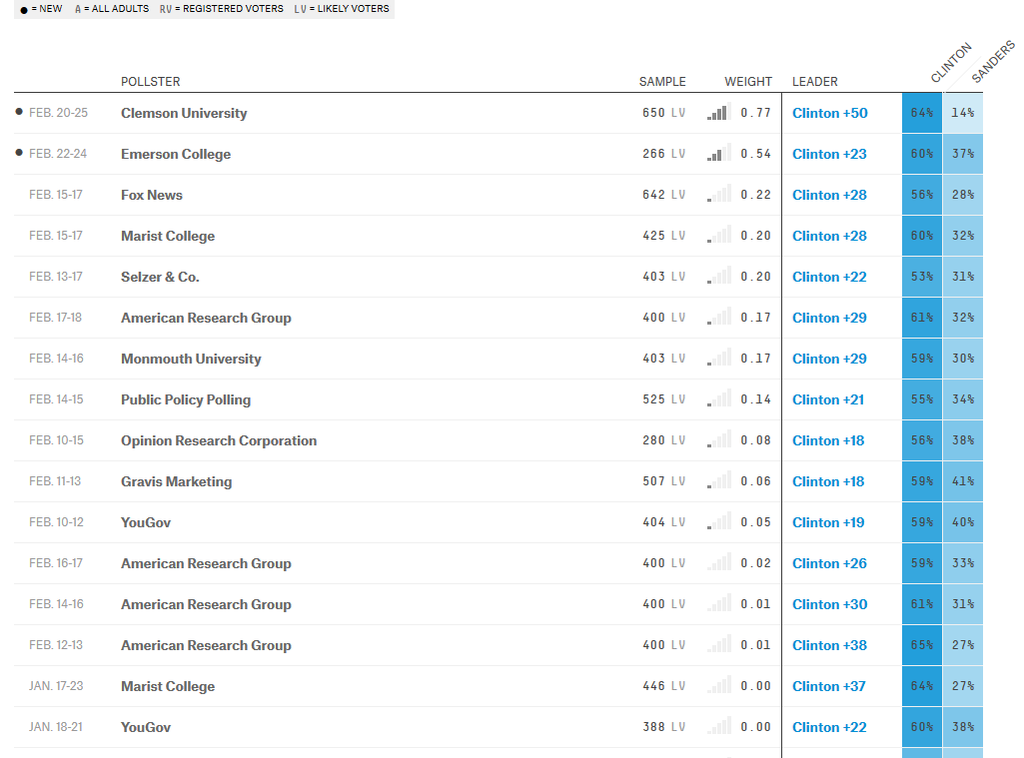
You can immediately see that a disproportionate amount of the weight for the 538 prediction comes from just the 2 most recent polls — from Clemson and Emerson. By contrast, my model distributes the weights much more over a larger number of polls that have been conducted over a longer period of time.
So 538's model would probably be better for a race in which there are large sudden changes in the state of the race — for example, the current GOP primary. On the other hand, if the race is more stable, then my model would probably be better. It is much more skeptical of sudden changes in polling. While these newer polls are certainly included and given strong weight in my model, it wants more confirmation of outlier results such as the Clemson poll before it is willing to believe that there has been a large, sudden shift.
My version of the weights also puts more emphasis on pollster quality than on the recency of the poll. My model puts the greatest weight on the Selzer poll, even though there are more recent polls. By contrast, the 538 model gives the Selzer poll a much smaller weight.
Another difference is that my model doesn’t just look at state polls in isolation, but compares the state polls to the national poll average. For example, since Sanders has gone up in the national polls over time, my model infers that he has probably gone up in South Carolina as well. So since Sanders has gone up by about 5 points since then in national poll averages, my model treats the Yougov poll from 1/17 — 1/21 as a relatively good result for Sanders (slightly better than the Yougov poll from 2/10 — 2/12, even though that had a narrower Clinton lead), because of the fact that the earlier Yougov poll showed Sanders doing better in comparison to national polls, while the later Yougov poll showed Sanders doing a bit worse in comparison to national polls than was previously the case.
Who Votes in South Carolina Democratic Primaries
One legacy of the Voting Rights Act is that many southern states collect reliable data about voter's race. When you register to vote in many Southern states, you not only put your name, address, and birthday, but also check a box for your race. More detailed data on voter turnout is available for southern states than for most states elsewhere. Demographic data on historical voter turnout is available from the South Carolina State Election Commission.
This voter file data matches very closely with 2008 South Carolina Democratic primary exit polls for some categories, like race and gender. Of course, that may be because the exit pollsters called up the South Carolina Secretary of State before matching their final adjusted exit poll to turnout statistics. However, it does not match closely for another category — age.
This chart shows the actual demographic data for actual Democratic primary voters in South Carolina between 1984 and 2014. However, data is only available for one Presidential primary — the 2008 Presidential primary. Note that they changed the age definitions in 2008, which is why I split this into two pieces. The rest of the data is all for regular (non-presidentail) primaries:
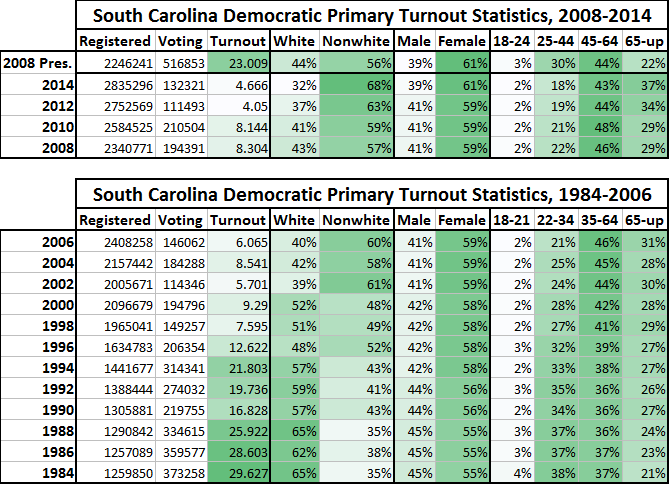
There are a number of trends you can notice from this:
- Since 1984, the white share of South Carolina Democratic primary voters has been steadily decreasing. This decrease has continued since 2008 (in non-presidential primaries from 2008 to 2014).
- Turnout has generally been decreasing at the same time (though it jumped up for the 2008 Presidential primary, in comparison to other non-Presidential primaries).
- Women's vote share has been steadily going up. That is not just because the parties have become more polarized by gender, but also is a reflection of the increasing dominance of African Americans (and especially older African Americans). African American men are disproportionately disenfranchised on a mass scale in America, and so when African American vote share goes up, that means that women’s vote share goes up as well. It’s also a reflection of the aging population — women live longer on average than men.
- The vote share for particularly young voters (18-21 from 1984 to 2006 and 18-24 from was very low. Consistently, it has been about 2% or 3%. The youngest eligible voters in South Carolina simply have not voted in large numbers in Democratic primaries. Not even in the 2008 Presidential primary.
- As the population has aged, a greater and greater share of the vote has been cast by older voters.
Generally, the demographics here are extremely favorable for Clinton. The electorate is likely to be very disproportionately made up of older African American women. And that’s Clinton’s best group.
This data raises the very important question of what share of the vote will be cast in 2016 by African Americans. The 2008 Non-White (primarily African American) vote share was about the same (slightly lower) than the 2006 and 2004 non-presidential primary Non-White vote share. But turnout overall was much higher. If you look at that naively, you might expect that Non-White vote share will be slightly lower than it was in the 2012 and 2014 non-presidential primaries (a bit less than 63% and 68%). However, that ignores a potentially very important factor — Obama was on the ballot, driving up African American turnout. Unfortunately, there is no data from the 2004 Presidential primary for comparison. 2004 Democratic primary exit polls say that the electorate was 51% white and 47% African American. However, I don't know just how reliable those numbers are. But if those numbers are correct, they suggest that Obama's presence on the ballot had a large effect in 2008. If that is the case, then African American vote share may be about the same as in 2008 or possibly even a bit lower.
So there are competing effects here:
-
The Aging Af-Am population effect — Aging of the African American population and the general trend towards increased African American turnout that began even before 2008 should continue. Advantage Clinton.
-
The Obama effect — With Obama on the ballot, African American turnout should be somewhat lower than otherwise. Advantage Sanders.
-
The old Dixiecrat effect — The decline of Dixiecrats and southern whites switching to the GOP should decrease the white vote share and increase the African American vote share. Advantage Clinton.
-
The non-Dixiecrat white liberal effect — This doesn't alter the African American vote share, but the decline of Dixiecrats should mean the remaining white voters are a bit more liberal. Advantage Sanders.
-
The Trump effect — Since the South Carolina GOP primary was first, some voters (especially white independents) may have voted in the GOP primary who would otherwise have voted in the democratic primary are more likely to have already voted in the GOP primary. Advantage Clinton.
I don't know how those competing effects will shake out. If I had to guess, I would say that African American vote share is more likely to go up a bit than to go down. But I doubt anyone else really knows either. If you think you do, let’s hear it in comments!
If the more pessimistic polls for Sanders turn out to be correct, I suspect it might actually be more because of an increase in African American vote share than because of any sudden shift in the dynamics of the race.
Comparison to Exit Polls
2008 exit polls in South Carolina incorrectly overestimated actual turnout of young voters. That’s not a hypothesis or a possibility. It's a straightforward fact. The exit polls said:
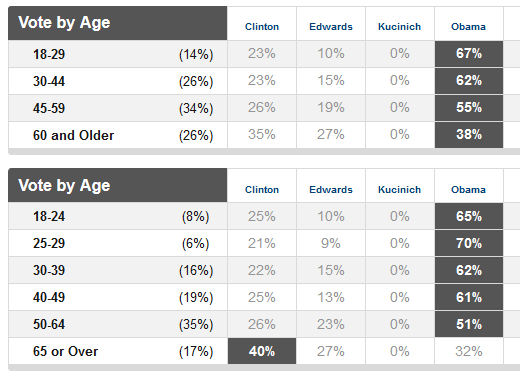
- The exit polls said that voters aged 18-24 made up 8% of the electorate. In reality, they made up 3% of the electorate.
- The exit polls said that voters aged 18-44 made up 40% of the electorate. In reality, they made up
These are all facts, not speculation.
Obama did not do well in South Carolina thanks to young voters. Instead, he did well thanks to support from older African American voters, and especially from older African American women.
I have some more interesting data on this sort of thing from Georgia’s Secretary of State office, which I will try to throw into a Super Tuesday preview diary in a few days. Suffice it to say for now that the exit polls in Georgia from 2008 were also demonstrably, factually wrong.
Updated national projection
Click here for a full projection for all Congressional districts in the US of the current state of the race (large image).
Click here for a full projection for all Congressional districts in the US under the scenario in which Sanders closes to a national tie with Clinton (large image).
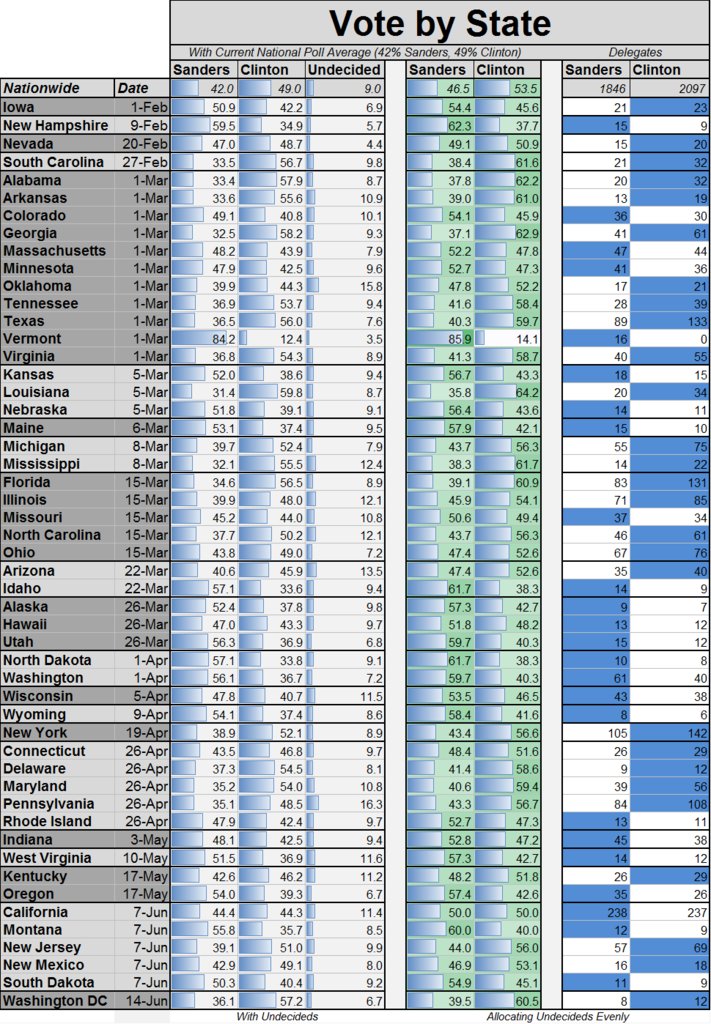
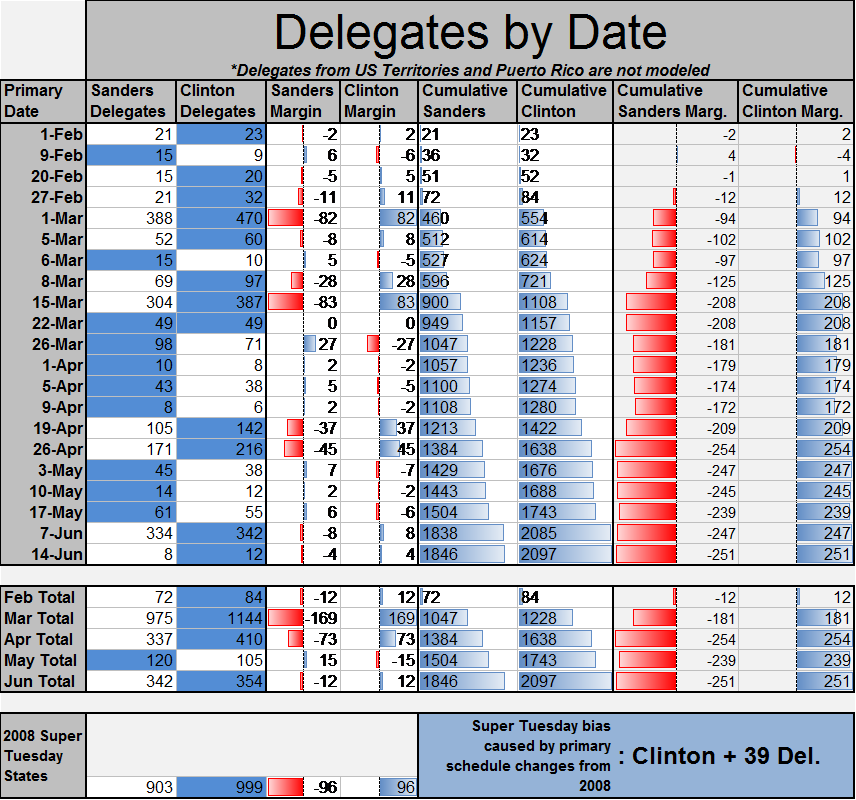
P.S. I voted yesterday! That’s +1 for Bernie Sanders in Texas. Yes, Clinton will almost certainly win Texas. But like I've been saying, it’s all about the margins and how that translates into delegates.
GOTV!
This is a continuing part of an ongoing series using polling data, past exit poll data, census data, and other data sources to analyze the 2016 Democratic Primary.
Previous posts are:
- Poll Meta-Analysis: The Bernie and Hillary 2016 Coalitions, and how they compare to 2008 Obama/HRC
- Poll Data Analysis: The Current State of the Democratic Primary
- How the delegate math shakes out for Bernie and Hillary down to the Congressional District level
- Bernie Sanders Did Much Better With Non-Whites In Iowa Than You Think
- Democratic Primary Model, Feb 8 Update (Pre-NH)
- Democratic Primary Model, Feb 9 Update (Pre-NH)
- Democratic Primary Polls for All 50 States
- Nevada Caucuses Preview and Democratic Primary Model Projections
- Why is Bernie putting resources into northern, not southern states? Cuz it's smart delegate strategy
- How Bernie Sanders can win the Democratic nomination
For more detail on how delegates are allocated across different states, check out this excellent resource from Torilahure.


